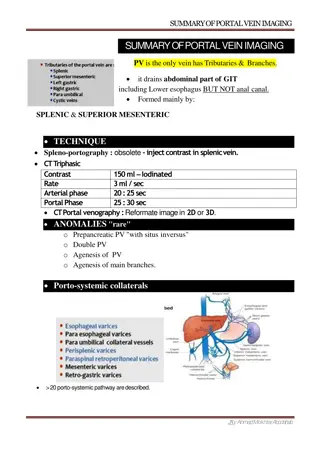
Industry Initiative: European Access Hurdles Portal Findings
The European Access Hurdles Portal, established in 2022, aims to enhance transparency in understanding the reasons behind delays and unavailability of innovative medicines. The industry's commitment to providing insights into root causes of unavailability is evident through the portal's reports. The recent report indicates industry-wide cooperation and data completeness, reflecting a high level of participation and representativeness. Key research questions addressed include the speed of marketing authorization, filing and reimbursement status, and root causes of delays in accessing new medicines. The report also compares Europe's regulatory timelines with other regions and explores reasons for non-filing of new medicines.

Download Presentation

Please find below an Image/Link to download the presentation.
The content on the website is provided AS IS for your information and personal use only. It may not be sold, licensed, or shared on other websites without obtaining consent from the author. Download presentation by click this link. If you encounter any issues during the download, it is possible that the publisher has removed the file from their server.
E N D
Presentation Transcript
European Access Hurdles Portal: Summary of the second external report 7th May 2024
The industry created the European Access Hurdles Portal to add new information to the debate on availability of innovative medicines Created in April 2022, the role of the Portal is to improve transparency regarding the root causes of unavailability and delay, including the role of the environment and its corresponding impact on commercial decision-making 2010 First report on the Patients W.A.I.T. (Waiting to Access Innovative Therapies) Indicator Root cause of unavailability and delay The reason why a company has not filed for P&R in a particular market The reason why there is a delay in the decision of Pricing and Reimbursement 2020-2022 Annual reporting on Patients W.A.I.T. Indicators and root causes of unavailability Ex-post information to be collected through EFPIA s Portal Targeting European Access Application for P&R or Filing information April 2022 Industry commitment to the creation of the European Access Hurdles Portal EFPIA s WAIT has information on availability and delay IRIS portal collects information on marketing status for all CAPs Ex-ante information collected on planned availabilitythrough DGSante s pilot April 2023 Release of the first public report from the Portal Marketing status information Novelty of the data June 2024 Release of the second public report from the Portal 2
Results indicate a complete willingness from industry to provide more transparency on the root causes of unavailability Industry participation Data completeness and representativeness Therapy areas of products approved by the EMA between Jan 2021-Jun 2023 Therapy areas of products included in the Portal dataset between Jan 2021-Jun 2023 Data on 66 products were submitted to the Portal. All received European marketing authorisation between January 2021 and June 2023. 66 All 32 EFPIA member companies with eligible products submitted data to the Portal (100% participation) 100% The analysis described in this report is therefore representative of 100% of all products approved by the EMA between January 2021 and June 2023 that are marketed by EFPIA members The therapy areas of Portal products and the composition of products approved by the EMA over the same time period are similar suggesting the products within the Portal are representative of the types of innovative medicines approved by the EMA over this period 100% 3 Abbreviations: EFPIA = European Federation of Pharmaceutical Industries and Associations; EMA = European Medicines Agency
This report presents an updated analysis focusing on a set of key research questions Speed of marketing authorisation Status of filing and reimbursement Speed of filing and reimbursement Root causes of delays To what extent is delayed reimbursement of new medicines due to the time taken at different steps of the P&R process? How does Europe compare to other regions in terms of the timing of marketing authorisation? What proportion of new medicines have been filed for P&R, and in how many countries? Where new medicines have not been filed for P&R in all countries, what are the most prevalent root causes of this? Of all new products approved by international regulators between January 2021 and June 2023, EMA approval came later, on average, than the US and by Japan by 327 days and 214 days respectively While there are delays in P&R filing in for some products in some countries, this is not a key driver of low availability of medicines in all countries (accounting for 29% of the total time between MA and reimbursement on average) Looking at the Portal s products (that are on average 20 months-post MA), taking an average across European countries, more than half of products have been filed for P&R The reasons for both delays in P&R filing and P&R decision making are multi-factorial, varying with respect to the region and the size of company filing for P&R 4 Abbreviations: EMA = European Medicines Agency; MA = marketing authorisation; P&R = pricing and reimbursement
Speed of marketing authorisation Status of filing and reimbursement Speed of filing and reimbursement Root causes of delays The products in-scope of the Portal received marketing authorisation later in Europe than in the US and Japan Key findings: Speed of marketing authorisation Date of EMA approvals relative to the US, UK, Japan and China Of all new products approved by international regulators between January 2021 and June 2022, EMA approval came later, on average, than the US and by Japan by 327 days and 214 days respectively; this is represents an increase since the April 2023 report For oncology drugs, European marketing authorisation happened, on average, 204 days later than Japan and 373 days behind the US. This represents a worrying trend versus 2023, where EMA approval came 47 days before PMDA For orphan products, although EMA approval comes 365 days after the US, it comes 94 days before Japan Legend: No. of dates used to calculate averages ( / 127): FDA to EMA FDA to PMDA FDA to NMPA FDA to MHRA This shows that even before considering the P&R process, Europe is slower in approving new products than the regulatory agencies in other regions1 All products 109 38 20 86 Oncology 36 7 8 32 Orphans 38 12 7 31 1. This lag may also be due at least in part to companies taking more time to file for marketing authorisation through the EMA compared to the FDA. Data on submission dates to the FDA and EMA are not publicly available. 5 Abbreviations: EMA = European Medicines Agency; FDA = Food and Drug Administration; MHRA = Medicines and Healthcare products Regulatory Agency; NMPA = National Medical Products Administration; PMDA = Pharmaceuticals and Medical Devices Agency
Speed of marketing authorisation Status of filing and reimbursement Speed of filing and reimbursement Root causes of delays In many instances of product unavailability, the products have in fact been filed for reimbursement but have not yet been reimbursed Status of product reimbursement and filing across countries Key findings: Status of filing and reimbursement 100% 8% 8% 11% 12% Looking at all products included in the Portal to date (products that are on average 20 months post-MA): 14% 0% 15% 17% 2% 90% 18% 20% 20% 23% 23% 0% 3% 26% 27% 29% 29% 12% 5% 36% 80% 39% 39% 5% 41% Taking an average across European countries, 56% of products have already been filed for P&R. Of which: 45%of filed products have been reimbursed 49%of filed products are pending a reimbursement decision 7%of filed products have had a negative reimbursement outcome A further 10%of non-filed products are available through an alternative access pathway 9% o 20% 2% 48% 9% 11% 50% 50% 53% 11% 56% 56% 58% 70% 44% 59% 8% 61% 6% 8% 42% 33% 24% 21% 76% 60% 58% 35% 14% 6% 24% 12% 23% 48% 50% 38% 32% 47% 29% 15% 9% 14% 6% 41% 5% 40% 23% 17% 8% 79% 23% 8% 29% 62% 9% 17% 30% 21% 14% 26% 11% 52% 20% 48% 32% 47% 44% 42% 42% 33% 20% 39% 21% 38% 12% 35% 32% 32% 30% 29% 29% 20% o 27% 24% 20% 23% 23% 10% 21% 20% 15% 15% 9% 9% 8% 5% 5% 5% 3% Malta 0% 2% Cyprus The percentage of products that have been filed for P&R varies significantly based on geography (e.g., CEE vs larger European markets), therapy area (e.g., Oncology, Orphan) and product type (e.g., ATMPs). Norway Italy Hungary Luxembourg Greece Germany Finland Ireland Slovenia Czechia Estonia France Sweden Austria Scotland Spain Netherlands England Bulgaria Poland Romania Latvia Croatia Lithuania Belgium Portugal Slovakia Denmark Not yet filed for P&R (unavailable through any public channel) Not yet filed for P&R (available through EAP/CAP/Other public channel) Filed for P&R (not-reimbursed) Reimbursed 6 Abbreviations: P&R = pricing and reimbursement; MA Marketing Authorisation
Speed of marketing authorisation Status of filing and reimbursement Speed of filing and reimbursement Root causes of delays While there are delays in P&R filing in for some products, this is not a key driver of low availability of medicines in all countries Key findings: Speed of filing and reimbursement Time to file for P&R as proportion of the total time until reimbursement following EMA marketing authorisation Although the Portal contains products that have been on the market for different lengths of time, across products that have been successfully reimbursed: 800 773 750 700 Total days since EMA marketing 649 650 591 600 551558 o 29% (or an average of 127 days) of the total time between EMA approval and availability can be attributed to the time between receiving EMA marketing authorization and P&R filing 550 520 522 authorisation 485 485 500 583 451 349360 364380 383 385392 392403423 427 428 450 351 400 338 334 291 563 340 350 317 322 275 242285 288 300 256 399 290 420 245 309 206 250 314 279 292 290 310 253 292 224216 200 o 71% (or an average of 307 days) of this time is attributable to the time between P&R filing and P&R decisions at the country-level 148211 259 150 182217 220240 229 100 190 176 171 154 147 138 114 106 101 50 96 95 94 93 91 89 86 86 82 74 72 65 29 Portugal 0 Italy Bulgaria Germany Norway England Romania Lithuania Latvia Netherlands Croatia Finland Sweden Scotland Slovakia Slovenia France Greece Estonia Ireland Czechia Spain Poland Austria Belgium Denmark Luxembourg This pattern varies across countries: the proportion of the total time taken up by the time it takes a company to file for P&R is lowest in EU4+UK markets (25% on average) and highest in CEE (30% on average) 180 day transparency directive* Time to reimbursement decision Time to P&R filing Note: Data is not available for all products in all countries. Where the sample size of products in any given country was less than three, these countries have been removed from the figure and include Cyprus, Malta and Hungary. This is due to the risk of bias in the results from a very small number of products and due to the risk of de-anonymizing individual products. The data reported for Germany should be interpreted as time to completion of the national P&R process rather than time to reimbursement, as authorised products are immediately eligible for reimbursement in Germany. *The time to the reimbursement decision does not distinguish between time taken for stop-clocks, negotiations with manufacturers and active decision-making by the national HTA body 7
Speed of marketing authorisation Status of filing and reimbursement Speed of filing and reimbursement Root causes of delays As set out in the root causes analysis, the reasons for both delays in P&R filing and P&R decision making are multi-factorial Key findings: Reasons for not filing for P&R Categorization of root causes Health system infrastructure Economic viability Lack of required healthcare infrastructure to support utilization The size of the treatable population Root causes for non-filing have been grouped according to the stage of the P&R process and the stakeholders involved Lack of company presence in the local market Lack of healthcare funding to support utilization The cost of launching is not recoverable P&R process Value assessment process There is an even spread across the different categories of root causes, reflecting the multi- factorial and varied nature of the P&R filing process Country filing requirements Evidence package unlikely to meet country requirements The impact of external reference pricing on other EU countries Low value attributed to class competitors Reasons for non-filing for P&R across all data collection cycles* The even distribution across different categories of root causes for non-filing underline that improving P&R filing rate is a shared responsibility, that will require a shared solution from all different stakeholders Note: The Other category was selected in 395 instances. These have been omitted from the root-causes analysis since they cannot be assigned to a specific root cause. Abbreviations: P&R = pricing and reimbursement 8
Speed of marketing authorisation Status of filing and reimbursement Speed of filing and reimbursement Root causes of delays As set out in the root causes analysis, the reasons for both delays in P&R filing and P&R decision making are multi-factorial Key findings: Reasons for not filing for P&R Distribution of reasons for non-filing for P&R in all countries, by country grouping* However, the reasons for non-filing for P&R clearly vary between regions of Europe: Delays in filing in Western Europe are largely due to the requirements of the value assessment process o Delays in filing in Central and Eastern Europe are largely due to health system infrastructure and the corresponding impact this has on commercial decision-making and resource allocation, captured under economic viability o *Country groupings: EU4+UK: England, France, Germany, Italy, Scotland, Spain Western (Other): Austria, Belgium, Ireland, Luxembourg, Netherlands, Portugal Southern: Cyprus, Greece, Malta CEE: Bulgaria, Croatia, Czechia, Estonia, Hungary, Latvia, Lithuania, Poland, Romania, Slovakia, Slovenia Nordic: Denmark, Finland, Norway, Sweden 9 Abbreviations: CEE = Central and Eastern Europe; P&R = pricing and reimbursement
Speed of marketing authorisation Status of filing and reimbursement Speed of filing and reimbursement Root causes of delays There is significant variation in the reason certain products have not filed for reimbursement in all European countries Anonymised distribution of product-level P&R filing across countries The reason for delayed filing varied from product to product. For some groups of products, the impact of external reference pricing was a key driver. In other cases, such as in Greece, country filing requirements was listed as the major reason for non-submission. This grid shows that there is significant variation across products. This is, in part, due to the length of time since the marketing authorization, but also because of the different types of product included. 10
Speed of marketing authorisation Status of filing and reimbursement Speed of filing and reimbursement Root causes of delays As set out in the root causes analysis, the reasons for both delays in P&R filing and P&R decision making are multi-factorial Key findings: Reasons for not yet filing for P&R Total number of reasons for non-filing for P&R by company size* The reasons for non-filing for P&R also vary between different sized companies: Delays in filing for Large companies are fairly well distributed across the root causes o However, delays in filing in Mid-sized companies relate largely to the economic viability of the decision to launch. More specifically, a Lack of company presence in the local market make up the majority of reasons for delay. o The distribution of reasons for non-filing in products that are available through other access pathways are different to the reasons for non-filing for unavailable products Reasons relating to economic viability are more common in available products. o *Company definitions: Large company: Top 20 companies in Europe by European Sales Medium company: Companies with > 500 million annual European sales, but outside the Top 20 Small company: Companies with < 500 million annual European sales only 1 small company participated in the Portal, and was grouped with Medium to maintain anonymity. 11 Abbreviations: CEE = Central and Eastern Europe; P&R = pricing and reimbursement
The Portal provides some initial insights on the factors affecting increasing filing rates How P&R filing rates change over time are impacted by a number of different factors: The overarching environment and situation in individual member states The length of time since products received marketing authorisation The type of products (e.g., orphan, oncology products) This highlights the importance of understanding the multifactorial reasons for non-filing when discussing potential mechanisms to improve filing rates Early indications highlight that some root causes are more easily addressed than others. 13 ceiling products were observed in the Portal, where we do not see any increase in P&R filing, irrespective of time since MA. These products are prevented from filing due to factors such as 'lack of healthcare funding to support utilization' and the evidence package being unlikely to meet country requirements , which are outside of manufacturers control. 12 Abbreviations: EFPIA = European Federation of Pharmaceutical Industries and Associations; EMA = European Medicines Agency; MA = Marketing Authorisation; ATMP Advanced Therapy Medicinal Products; CTF Commitment to File.
Key conclusions of the second European Access Hurdles Portal report There is a complete willingness from industry to provide more transparency on the root causes of unavailability, with 100% of eligible EFPIA companies submitting data to the Portal The data collected in the Portal has matured, enabling more in depth-analysis and the generation of new insights on delays in P&R filing and the lack of availability in some products: 1. 2. Speed of marketing authorisation Status of filing and reimbursement Speed of filing and reimbursement Root causes of delays Even before considering the P&R process, new products received regulatory approval later in Europe than in other regions In many instances of product unavailability, the products have in fact been filed for reimbursement but have not yet been reimbursed While there are delays in P&R filing for some products in some countries, this is not a key driver of low availability of medicines in all countries The reasons for both delays in P&R filing and P&R decision-making are multi-factorial, varying across regions and company size 3. These findings indicate that availability of centrally authorized medicines to patients in European countries is a shared responsibility, requiring a shared solution, necessitating EU-wide, subregion-specific and even country-specific solutions This is the second report from the Portal; the data collected in the Portal will continue to mature as more cycles of data are collected. This will allow us to further validate some of these early results and to look in more detail at the underlying root causes, as well as any changes to filing rate over time 4. 13