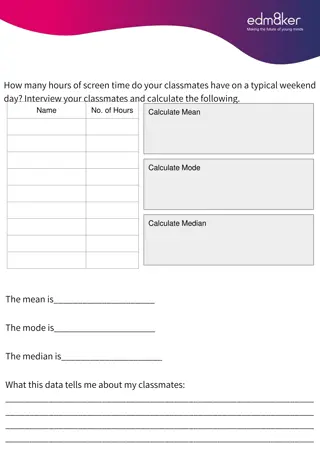
Understanding mean, median, and mode in statistics

In statistics, the mean represents the average value, the median is the middle value that divides a dataset into two halves, and the mode is the most frequent value. This guide explains how to calculate these statistical measures and provides examples. Additionally, it demonstrates how to estimate the mean from a group frequency table and determine the location of mode and median in a dataset based on cumulative frequency. Explore the concepts of range, mode, and median with practical examples and illustrations.

Download Presentation

Please find below an Image/Link to download the presentation.
The content on the website is provided AS IS for your information and personal use only. It may not be sold, licensed, or shared on other websites without obtaining consent from the author. Download presentation by click this link. If you encounter any issues during the download, it is possible that the publisher has removed the file from their server.
E N D
Presentation Transcript
Sixth lecture Lec 6
Median : the statistical concept of the median is a value that divides a data sample, population, or probability distribution into two halves. Finding the median essentially involves finding the value in a data sample that has a physical location between the rest of the numbers. The median is the mean of the two middle values. To calculate the median of a data set we have to follow the below: Arrange your data from the smallest number to the highest one. If your data set consist of odd number of values (its very easy to find the median) as bellow: Ex: Class grades for students are 11,12,6,13,8,14,9 find the median for the students scores? 6, 8, 9,11,12,13,14 Median = 11 If your data set consist of even number of values (its very easy to find the median) as bellow: Ex: Class grades for students are 11,12,6,13,5,8,14,9 find the median for the students scores? 5, 6, 8, 9,11,12,13,14 = (9+11)\2 = 10 Median = 10
Mode : in statistics, the mode is the value in a data set that has the highest number of recurrences . It is possible for a data set to be multimodal , meaning that it has more than one mode. Ex: Class students ages are 22,18,19,17,23,39,21,22,39 years old, find the mode for the students ages? 17,18,19,21,22,22,23,39,39 Mode =22, 39 both 22and 39 appear twice each, making them both a mode for the data set above. Range: the range of a data set in statistics is the difference between the largest and the smallest values. While range does have different meanings within different areas of statistics and mathematics, this is its most basic definition, and is what is used by the provided calculator. Using the same example: Class students ages are 22,18,19,17,23,39,21,22,39 years old, find the mode for the students ages? 17,18,19,21,22,22,23,39,39 Range = 39-17= 22
How to calculate mean, median and mode of a group frequency table? How to calculate the average test score of the students in the class? We cant calculate the mean by using the classic way BECAUSE we don t know the actual score for each students ; so we can estimate the mean following this way: Mean = [f * m] \ f = 2804.5\38= 73.8 = sum , f= frequency , m= midpoint , Cf= Cumulative frequency m = (lower boundary value + upper boundary value) \2 The Mean is between 70-79 because most students scored at that range. In which value do you expect the mode and the median could be located? Since the mode is occurs when the frequency is the highest ! And the highest frequency is 9 so the mode is between 70-79 BUT what about the median? In order to figure that out we need to calculate cumulative frequency and the Cf is=38 which is equal to the total frequency number because there are 38 students, the half of 38 is 19 which is somewhere between 14 and 23 so after 14 we will start with 15. The median is somewhere between 70-79 Grade f Mid point value 44.5 54.5 64.5 74.5 84.5 95 f * m C f 40-49 50-59 60-69 70-79 80-89 90-100 3 5 6 9 8 7 133.5 272.5 387 670.5 676 665 = 2804.5 3 8 14 23 31 38 =38
700 600 500 90-100 80-89 400 70-79 300 60-69 200 Test score of the students in the class 50-59 38 100 31 40-49 0 23 C f f f * m C f 14 8 40-49 50-59 60-69 70-79 80-89 90-100 3 665 Test score of the students in the class 676 670.5 f * m 387 272.5 133.5 7 8 9 f 6 5 3 0 100 200 300 400 500 600 700 800 90-100 80-89 70-79 60-69 50-59 40-49
How to calculate mean, median and mode of a group frequency table listed below? Weight Kg f Mid point value 129.5 149.5 f * m Cf Mean = [f * m] \ f = 5963.5\ 36 = 165.7 The mean is between 160-179 because most of the people recorded high weight at that range1 120-139 140-159 6 8 777 1196 6 14 160-179 180-199 200-220 12 7 3 169.5 189.5 210 2034 1326.5 630 =5963.5 26 33 36 In which value do you expect the mode and the median could be located? Since the Mode is occurs when the frequency is the highest ! And the highest frequency is 12 so the Mode is between 160-179 BUT what about the median? In order to figure that out we need to calculate cumulative frequency and the Cf is=36 which is equal to the total frequency number because there are 36 of people, the half of 36 is 18 which is somewhere between 14 and 26 so after 14 we will start with 15. The Median is somewhere between 160-179 666 1.411.5565 411.5565 =36
2500 2000 1500 2500 People weight 1000 2000 500 1500 0 f Mid point value f * m C*f 120-139 140-159 160-179 180-199 200-220 1000 People weight 500 0 120-139 140-159 160-179 180-199 200-220 f Mid point value f * m C*f
How to calculate mean, median and mode of a group frequency table listed below? Height cm f Mid point value f*m Cf Mean = [f * m] \ f = 6547.5\ 45 = 145.5 The mean is between 140-159 because most of the people recorded their height at that range1 100-119 8 109.5 876 8 120-139 10 129.5 1295 18 In which value do you expect the mode and the median could be located? Since the Mode is occurs when the frequency is the highest ! And the highest frequency is 14 so the Mode is between 140- 159 BUT what about the median? In order to figure that out we need to calculate cumulative frequency and the Cf is=45 which is equal to the total frequency number because there are 45 of people, the half of 45 is 22.5 which is somewhere between 18 and 32 so after 18 we will start with 19. The Median is somewhere between 140-159 140-159 14 149.5 2093 32 160-179 9 169.5 1525.5 41 180-199 4 189.5 758 45 =45 =6547.5
2500 2000 1500 1000 People height 2500 500 2000 0 100-119 120-139 140-159 160-179 180-199 f Mid point value f*m Cf 1500 People height 1000 500 0 f Mid point value f*m Cf 100-119 120-139 140-159 160-179 180-199
How to calculate mean, median and mode of a group frequency table listed below? Grade f Mid point value 24.5 34.5 44.5 54.5 64.5 74.5 f*m Cf Mean = [f * m] \ f = 2705\ 50 = 54.1 The mean is between 50-59 because most of the people recorded their height at that range1 20-29 30-39 40-49 50-59 60-69 70-79 2 5 49 2 7 172.5 534 763 516 670.5 12 14 8 9 19 33 41 50 In which value do you expect the mode and the median could be located? Since the Mode is occurs when the frequency is the highest ! And the highest frequency is 14 so the Mode is between 50 - 59 BUT what about the median? In order to figure that out we need to calculate cumulative frequency and the Cf is=50 which is equal to the total frequency number because there are 50 of people, the half of 50 is 25 which is somewhere between 19 and 32 so after 19 we will start with 20. The Median is somewhere between 50-59 = 50 = 2705
900 800 700 600 500 400 300 Students grade 200 900 100 800 0 700 f Mid point value f*m Cf 600 20-29 30-39 40-49 50-59 60-69 70-79 Students grade 500 400 300 200 100 0 20-29 30-39 40-49 50-59 60-69 70-79 f Mid point value f*m Cf