Exploring Descriptive Statistics: Understanding Data through Stories
LESSON 1
Intro, NOTES/examples, classwork, discussion
Module 2: Descriptive Statistics
Statistics is all about data. Without data to talk about or to
analyze or to question, statistics would not exist. There is a
story to be uncovered behind all data—a story that has
characters, plots, and problems. The questions or problems
addressed by the data and their story can be disappointing,
exciting, or just plain ordinary. This module is about stories
that begin with data.
Notes
To calculate:
Mean
: add all the numbers, divide by the
number of numbers in data set
Median
: put in order, find middle number; if two
are in the middle, add and divide by 2.
Mode
: most commonly seen number (can be
more than 1 or no mode)
Range
: highest minus the lowest number
Notes/Examples
Dot Plot
: A plot of each data value on a scale or
number line.
Number line with title; a dot for each data point,
stacking when numbers are repeated.
Notes/Examples
Histogram
: A graph of data that groups the data
based on intervals and represents the data in
each interval by a bar.
Similar to a bar graphs, but bars represent a range of
numerical values rather than categorical.
Notes/Examples
Box (and Whisker) Plot
: A graph that provides a
picture of the data ordered and divided into four
intervals that each contains
25%
of the data
Need to calculate
median
,
1
st
quartile
(median of
lower half), and
3
rd
quartile
(median of upper half).
Lowest
number
Highest
number
First
quartile
Third
quartile
Median
Workshop
Must Do
•
Classwork1 #1-15
May Do
•
Khan Academy
•
Fluency practice
•
Reflection questions
Reflection Questions
•
What are reasons that a scheduled airline flight might be delayed?
•
What are some of the favorite television shows of the students in
your class? List some of the most memorable commercials that
are shown during those shows. In your opinion, do the
commercials connect with the viewers?
•
You walk into a store. You estimate that most of the customers are
between fifty and sixty years old. What kind of store do you think it
is?
•
If you asked students in your class how many pets they owned,
what do you think would be a typical value?
•
You are selected to take a trip to Kenya. Do you think you will meet
several people ninety or older? Why or why not?
LESSON 2
Modeling, Notes, Intro/Overview, Classwork
Modeling Cycle
Intro/Overview
Can we assume that all students interpret the question “How many pets do you
currently own?” in the same way?
Intro/Overview
Why would the same hallway have different reported measures of length?
What measures of the length of the hallway do you think are the most accurate from
the data set?
Intro/Overview
What number would you use to describe the typical age of cars in years by the car
owners in this group?
Workshop
Must Do
•
Classwork2 #1-10
May Do
•
Complete cw #1
•
Khan Academy
Summary/Notes
•
Dot plots provide a visual that help us see how
data are distributed.
•
Mean and median are numerical summaries of
the center of data.
•
W
h
e
n
d
a
t
a
i
s
n
e
a
r
l
y
s
y
m
m
e
t
r
i
c
a
l
,
t
h
e
m
e
a
n
a
n
d
m
e
d
i
a
n
a
r
e
a
p
p
r
o
x
i
m
a
t
e
l
y
e
q
u
a
l
a
n
d
t
h
e
m
e
a
n
i
s
t
h
e
b
e
s
t
c
h
o
i
c
e
t
o
r
e
p
r
e
s
e
n
t
t
h
e
d
a
t
a
.
•
W
h
e
n
s
k
e
w
e
d
,
t
h
e
m
e
a
n
/
m
e
d
i
a
n
a
r
e
n
o
t
t
h
e
s
a
m
e
a
n
d
t
h
e
m
e
d
i
a
n
i
s
t
h
e
b
e
t
t
e
r
c
h
o
i
c
e
.
LESSON 3
Example/demonstration, classwork, summary
Example
A
12
-inch ruler has several quarters taped to positions along the ruler.
The broad side of a pencil is placed underneath the ruler to determine an
approximate balance point of the ruler with the quarters.
1)
Sam taped
3
quarters to his ruler. The quarters were
taped to the positions
1
inch,
9
inches, and
11
inches. If
the pencil was placed under the position
5
inches, do you
think the ruler would balance? Why or why not?
2)
If the ruler did not balance, would you move the pencil to
the left or to the right of
5
inches to balance the ruler?
Explain your answer.
Example, continued
3
)
E
s
t
i
m
a
t
e
a
b
a
l
a
n
c
e
p
o
i
n
t
f
o
r
t
h
e
r
u
l
e
r
.
4) What is the sum of the distances to the right of your
estimate of the balance point?
5) What is the sum of the distances to the left of your
estimate of the balance point?
Example, continued
6) Do you need to adjust the position of your balance point?
If yes, explain how.
7) Calculate the mean and the median of the position of the
quarters. Does the mean or the median of the positions
provide a better estimate of the balance point for the position
of the
3
quarters taped to this ruler? Explain why you made
this selection.
Workshop
Must Do
•
Classwork 3 #1-13
May Do
•
Complete cw #1-2
•
KhanAcademy
Summary/Notes
The mean of a data set represents a balance point
for the distribution. The sum of the distances to the
right of the mean is equal to the sum of the
distances to the left of the mean.
LESSON 4
Warm up, Notes/Example, classwork
Warm Up
A consumers’ organization is planning a study of various
brands of batteries. It measures lifetime (i.e., how long a
battery can be used before it must be replaced) for six
batteries of Brand A and eight batteries of Brand B. Dot plots
showing the battery lives for each brand are shown below.
1)
Does one brand of battery tend to last longer, or are they roughly the same? What
calculations could you do in order to compare the battery lives of the two brands?
2)
Do the battery lives tend to differ more from battery to battery for Brand A or for
Brand B?
3)
Would you prefer a battery brand that has battery lives that do not vary much from
battery to battery? Why or why not?
Example
The table below shows the lives (in hours) of the Brand A batteries.
Calculate the deviations from the mean by subtracting the mean from
each value.
Ignoring the signs of the deviations, which data set tends to
have larger deviations from the mean? Why, do you think?
Notes
Variability
- the spread of a data set
Deviations from the mean
- data points minus the mean (
x
-
)
The greater the variability of the distribution, the greater the
deviations from the mean
Workshop
Must Do
•
Classwork exercises 1-11
May Do
•
Complete classworks 1-3
•
KhanAcademy
•
Puzzles (back wall)
•
“Play” with graphing
calculators using the
handbook
Formally Estimating Mean from a Histogram
Since actual values cannot be determined from a histogram, you assume
each value is the number in the middle of the bar.
LESSON 5
Notes/Example, classwork, discussion
Example
Here is a dot plot of the lives of the Brand A
batteries from Lesson 4.
•
The mean was 101 hours (
mark
)
•
What’s a typical deviation from the mean for these Brand A batteries?
Notes - Standard Deviation
Measures a typical deviation from the mean.
1)
Find the mean of the data set.
2)
Calculate the deviations from the mean.
3)
Square the deviations from the mean.
4)
Add up the squared deviations.
5)
Divide by 1 less than the number of data points.
6)
Take the square root.
Example/Notes - Standard Deviation
1)
First, find each deviation from the mean
(lesson 4)
2)
Then square the deviations from the mean.
3) Add the squared deviations.
4) Divide by 1 less than the number of data points (n - 1)
Go to several decimal places
Workshop
Must Do
•
Exit ticket #3-4
•
Classwork exercises 1-8
May Do
•
KhanAcademy
•
Crossing the River
problem
•
“Play” with the graphing
calculator TOOLS
Closing
•
What does it mean that the standard deviation for Brand B is
greater than the standard deviation for Brand A?
•
What would we get if we just added the deviations from the mean
without squaring them?
•
Why do you think we square the deviations?
•
Why do we take the square root?
•
Why divide by n - 1?
Brand B has greater variability, meaning the battery life is less
predictable/it varied more.
0 - remember that mean is the balance point.
One way to get rid of negative signs and avoid adding to 0.
Because you squared all the deviations so you need to un-do that.
“Careful study” has shown that it gives a more accurate answer
Notes - Standard Deviation
Measures a typical deviation from the mean.
1)
Find the mean of the data set.
2)
Calculate the deviations from the mean.
3)
Square the deviations from the mean.
4)
Add up the squared deviations.
5)
Divide by 1 less than the number of data points.
6)
Take the square root.
The larger the standard deviation, the greater the
spread or variability of the data set.
LESSON 6
Warm Up, examples, notes, workshop
Warm Up
Here are the heights of eight men (in inches):
67.0 70.9 67.6 69.8 69.7 70.9 68.7 67.2
Find the mean and standard deviation to the nearest
hundredth.
Mean = 68.98 inches
Standard Deviation = 1.59 inches
Wow, isn’t technology nice?
Take out your calculator handbook and find the
page titles “calculating statistics.
Classwork Clarification
For #2, what does the single dot at #4 mean?
Workshop
Must Do
•
Complete classwork5
•
Classwork6 exercises 1-5
May Do
•
KhanAcademy
•
“Play” with the graphing
calculator TOOLS
•
Crossing the River
problem
•
Inky puzzles
Summary
#4-5) The size of the standard deviation is related to the
sizes of the deviations from the mean. Therefore, the
standard deviation is minimized when all the numbers in the
data set are the same and is maximized when the deviations
from the mean are made as large as possible.
Mound Shaped
Uniform
LESSON 7
Opening, notes, example, workshop
Warm Up
•
Approximately where would you locate the mean (balance point) in
the above distribution?
•
How does the direction of the tail affect the location of the mean age
compared to the median age?
•
The mean age of the above sample is approximately
50
. Do you
think this age describes the typical viewer of this show? Explain your
answer.
Opening
Recall that in lessons 5 & 6 all the data we looked at was
basically symmetrical. This is why it made sense to use the
mean and standard deviation to analyze the data set’s
variability.
Today, we look at skewed data and how to analyze
variability using the median.
Opening
•
What does the dot farthest left tell us?
•
Is this symmetrical? What’s a typical age?
•
Some claim this is a “cross-generational” show? What
does this mean and does the data agree?
Notes: Skewed Data
Left-skewed
means that the data has a
tail
to the left.
Right-skewed
means that the data has a
tail
to the right.
When data is skewed, you need to use the median as a better
measure of center to eliminate the impact of the tail.
Since the median is a better measure of center, we also need
a different measure of variability: the
Interquartile Range
- defines the length of the interval where
50% of the data falls. (3
rd
/upper quartile - 1
st
/lower quartile)
Outliers
- data that falls more than 1.5xIQR from the nearest
quartile. Indicated on the box plot with a *
Box Plots - again
Workshop
Must Do
•
Exit ticket #5-6
•
Classwork7 #1-17
May Do
•
KhanAcademy
•
“Play” with the graphing
calculator TOOLS
•
Crossing the River
problem
•
Folder organize
•
Note sheet
•
Inky puzzles
LESSON 8
Intro, classwork
Intro
•
What percent of people are younger than 5?
•
What ages are represented by the bars/intervals?
•
What does the first bar mean in the US histogram?
Intro
•
What information is displayed in a box plot?
•
What does the * represent?
•
Can we find this information in the histogram?
•
The box plot is based on a a sample, histogram on whole
population!
Workshop
Must Do
•
Classwork8 #1-16
•
Complete all cw/hw 1-8
May Do
•
KhanAcademy
•
“Play” with the graphing
calculator TOOLS
•
Crossing the River
problem
•
Folder organize
•
Note sheet
•
Inky puzzles
This lesson introduces the importance of statistics in understanding data narratives. From calculating mean, median, mode, and range to visual representations like dot plots, histograms, and box plots, students delve into exploring stories hidden within data sets. The classwork involves Khan Academy fluency practice and reflection questions on topics like airline delays, favorite TV shows, and customer demographics. Engage in a journey of discovering insights and connections through statistical analysis.

Download Presentation

Please find below an Image/Link to download the presentation.
The content on the website is provided AS IS for your information and personal use only. It may not be sold, licensed, or shared on other websites without obtaining consent from the author. Download presentation by click this link. If you encounter any issues during the download, it is possible that the publisher has removed the file from their server.
E N D
Presentation Transcript
LESSON 1 Intro, NOTES/examples, classwork, discussion
Module 2: Descriptive Statistics Statistics is all about data. Without data to talk about or to analyze or to question, statistics would not exist. There is a story to be uncovered behind all data a story that has characters, plots, and problems. The questions or problems addressed by the data and their story can be disappointing, exciting, or just plain ordinary. This module is about stories that begin with data.
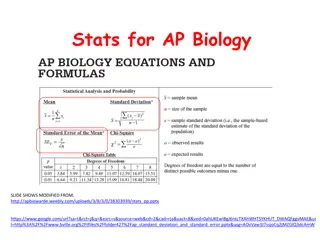
Notes To calculate: Mean: add all the numbers, divide by the number of numbers in data set Median: put in order, find middle number; if two are in the middle, add and divide by 2. Mode: most commonly seen number (can be more than 1 or no mode) Range: highest minus the lowest number
Notes/Examples Dot Plot: A plot of each data value on a scale or number line. Number line with title; a dot for each data point, stacking when numbers are repeated.
Notes/Examples Histogram: A graph of data that groups the data based on intervals and represents the data in each interval by a bar. Similar to a bar graphs, but bars represent a range of numerical values rather than categorical.
Notes/Examples Box (and Whisker) Plot: A graph that provides a picture of the data ordered and divided into four intervals that each contains 25% of the data Highest number Lowest number Median First quartile Third quartile Need to calculate median, 1stquartile (median of lower half), and 3rdquartile (median of upper half).
Workshop Must Do May Do Classwork1 #1-15 Khan Academy Fluency practice Reflection questions
Reflection Questions What are reasons that a scheduled airline flight might be delayed? What are some of the favorite television shows of the students in your class? List some of the most memorable commercials that are shown during those shows. In your opinion, do the commercials connect with the viewers? You walk into a store. You estimate that most of the customers are between fifty and sixty years old. What kind of store do you think it is? If you asked students in your class how many pets they owned, what do you think would be a typical value? You are selected to take a trip to Kenya. Do you think you will meet several people ninety or older? Why or why not?
LESSON 2 Modeling, Notes, Intro/Overview, Classwork
Intro/Overview Can we assume that all students interpret the question How many pets do you currently own? in the same way?
Intro/Overview Why would the same hallway have different reported measures of length? What measures of the length of the hallway do you think are the most accurate from the data set?
Intro/Overview What number would you use to describe the typical age of cars in years by the car owners in this group?
Workshop Must Do May Do Classwork2 #1-10 Complete cw #1 Khan Academy
Summary/Notes Dot plots provide a visual that help us see how data are distributed. Mean and median are numerical summaries of the center of data. When data is nearly symmetrical, the mean and median are approximately equal and the mean is the best choice to represent the data. When skewed, the mean/median are not the same and the median is the better choice.
LESSON 3 Example/demonstration, classwork, summary
Example A 12-inch ruler has several quarters taped to positions along the ruler. The broad side of a pencil is placed underneath the ruler to determine an approximate balance point of the ruler with the quarters. 1) Sam taped 3 quarters to his ruler. The quarters were taped to the positions 1 inch, 9 inches, and 11 inches. If the pencil was placed under the position 5 inches, do you think the ruler would balance? Why or why not? 2) If the ruler did not balance, would you move the pencil to the left or to the right of 5 inches to balance the ruler? Explain your answer.
Example, continued 3) Estimate a balance point for the ruler. 4) What is the sum of the distances to the right of your estimate of the balance point? 5) What is the sum of the distances to the left of your estimate of the balance point?
Example, continued 6) Do you need to adjust the position of your balance point? If yes, explain how. 7) Calculate the mean and the median of the position of the quarters. Does the mean or the median of the positions provide a better estimate of the balance point for the position of the 3 quarters taped to this ruler? Explain why you made this selection.
Workshop Must Do May Do Classwork 3 #1-13 Complete cw #1-2 KhanAcademy
Summary/Notes The mean of a data set represents a balance point for the distribution. The sum of the distances to the right of the mean is equal to the sum of the distances to the left of the mean.
LESSON 4 Warm up, Notes/Example, classwork
Warm Up A consumers organization is planning a study of various brands of batteries. It measures lifetime (i.e., how long a battery can be used before it must be replaced) for six batteries of Brand A and eight batteries of Brand B. Dot plots showing the battery lives for each brand are shown below. 1) Does one brand of battery tend to last longer, or are they roughly the same? What calculations could you do in order to compare the battery lives of the two brands? 2) Do the battery lives tend to differ more from battery to battery for Brand A or for Brand B? 3) Would you prefer a battery brand that has battery lives that do not vary much from battery to battery? Why or why not?
Example The table below shows the lives (in hours) of the Brand A batteries. Calculate the deviations from the mean by subtracting the mean from each value. This table shows the battery lives and deviations from the mean for Brand B. Ignoring the signs of the deviations, which data set tends to have larger deviations from the mean? Why, do you think?
Notes Variability - the spread of a data set Deviations from the mean - data points minus the mean (x -) x The greater the variability of the distribution, the greater the deviations from the mean
Workshop Must Do May Do Classwork exercises 1-11 Complete classworks 1-3 KhanAcademy Puzzles (back wall) Play with graphing calculators using the handbook
Formally Estimating Mean from a Histogram Since actual values cannot be determined from a histogram, you assume each value is the number in the middle of the bar.
LESSON 5 Notes/Example, classwork, discussion
Example Here is a dot plot of the lives of the Brand A batteries from Lesson 4. 85 90 95 Battery life (hours) 100 105 110 115 The mean was 101 hours (mark) What s a typical deviation from the mean for these Brand A batteries?
Notes - Standard Deviation Measures a typical deviation from the mean. 1) Find the mean of the data set. 2) Calculate the deviations from the mean. 3) Square the deviations from the mean. 4) Add up the squared deviations. 5) Divide by 1 less than the number of data points. 6) Take the square root.
Example/Notes - Standard Deviation 85 90 95 Battery life (hours) 100 105 110 115 1) 2) First, find each deviation from the mean (lesson 4) Then square the deviations from the mean. 3) Add the squared deviations. 4) Divide by 1 less than the number of data points (n - 1) Go to several decimal places
Workshop Must Do May Do Exit ticket #3-4 Classwork exercises 1-8 KhanAcademy Crossing the River problem Play with the graphing calculator TOOLS
Closing What does it mean that the standard deviation for Brand B is greater than the standard deviation for Brand A? Brand B has greater variability, meaning the battery life is less predictable/it varied more. What would we get if we just added the deviations from the mean without squaring them? 0 - remember that mean is the balance point. Why do you think we square the deviations? One way to get rid of negative signs and avoid adding to 0. Why do we take the square root? Because you squared all the deviations so you need to un-do that. Why divide by n - 1? Careful study has shown that it gives a more accurate answer
Notes - Standard Deviation Measures a typical deviation from the mean. 1) Find the mean of the data set. 2) Calculate the deviations from the mean. 3) Square the deviations from the mean. 4) Add up the squared deviations. 5) Divide by 1 less than the number of data points. 6) Take the square root. The larger the standard deviation, the greater the spread or variability of the data set.
LESSON 6 Warm Up, examples, notes, workshop
Warm Up Here are the heights of eight men (in inches): 67.0 70.9 67.6 69.8 69.7 70.9 68.7 67.2 Find the mean and standard deviation to the nearest hundredth. Mean = 68.98 inches Standard Deviation = 1.59 inches
Wow, isnt technology nice? Take out your calculator handbook and find the page titles calculating statistics.
Classwork Clarification For #2, what does the single dot at #4 mean?
Workshop Must Do May Do Complete classwork5 Classwork6 exercises 1-5 KhanAcademy Play with the graphing calculator TOOLS Crossing the River problem Inky puzzles
Summary Uniform Mound Shaped #4-5) The size of the standard deviation is related to the sizes of the deviations from the mean. Therefore, the standard deviation is minimized when all the numbers in the data set are the same and is maximized when the deviations from the mean are made as large as possible.
LESSON 7 Opening, notes, example, workshop
Warm Up Approximately where would you locate the mean (balance point) in the above distribution? How does the direction of the tail affect the location of the mean age compared to the median age? The mean age of the above sample is approximately 50. Do you think this age describes the typical viewer of this show? Explain your answer.
Opening Recall that in lessons 5 & 6 all the data we looked at was basically symmetrical. This is why it made sense to use the mean and standard deviation to analyze the data set s variability. Today, we look at skewed data and how to analyze variability using the median.
Opening What does the dot farthest left tell us? Is this symmetrical? What s a typical age? Some claim this is a cross-generational show? What does this mean and does the data agree?
Notes: Skewed Data Left-skewed means that the data has a tail to the left. Right-skewed means that the data has a tail to the right. When data is skewed, you need to use the median as a better measure of center to eliminate the impact of the tail. Since the median is a better measure of center, we also need a different measure of variability: the Interquartile Range - defines the length of the interval where 50% of the data falls. (3rd/upper quartile - 1st/lower quartile) Outliers - data that falls more than 1.5xIQR from the nearest quartile. Indicated on the box plot with a *
Workshop Must Do May Do Exit ticket #5-6 Classwork7 #1-17 KhanAcademy Play with the graphing calculator TOOLS Crossing the River problem Folder organize Note sheet Inky puzzles
LESSON 8 Intro, classwork
Intro What percent of people are younger than 5? What ages are represented by the bars/intervals? What does the first bar mean in the US histogram?
Intro What information is displayed in a box plot? What does the * represent? Can we find this information in the histogram? The box plot is based on a a sample, histogram on whole population!