Understanding Measures of Center in Data Analysis
Explore the concepts of mode, mean, and median to measure the center of discrete data sets. Discover how these statistics help us understand the distribution and variability of data. Learn how to calculate the mode, mean, and median using practical examples. Gain insights into the importance of these measures in statistical analysis.

Uploaded on Oct 09, 2024 | 0 Views
Download Presentation

Please find below an Image/Link to download the presentation.
The content on the website is provided AS IS for your information and personal use only. It may not be sold, licensed, or shared on other websites without obtaining consent from the author. Download presentation by click this link. If you encounter any issues during the download, it is possible that the publisher has removed the file from their server.
E N D
Presentation Transcript
9 October 2024 Measuring the centre of discrete data LO: To calculate the mode, mean and median of discrete data. www.mathssupport.org
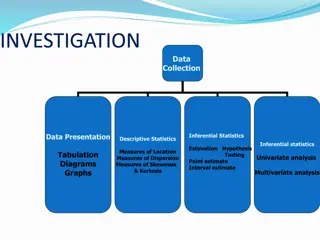
Measuring the centre of data We can get a better understanding of a data set if we can locate its middle or centre, and also get an indication of its spread or dispersion There are three statistics that are used to measure the centre of a data set MEAN MODE MEDIAN middle value sum of values number of values most common We will examine later three different measures of spread or dispersion: the range, the interquartile range (IQR) and the standard deviation. www.mathssupport.org
The mode The most common item is called the mode. The mode is the item that occurs the most often in a data set. For grouped numerical data, we talk about a modal class, which is the class that occurs most frequently. Is it possible to have more than one modal value? Yes If a set of scores has two modes we say it is bimodal. If there are more than two modes we do not use mode as a measure of the centre. Is it possible to have no modal value? Yes www.mathssupport.org
The mode This is the number of students in each class of a school, find the mode. 13 12 15 13 18 14 16 15 15 17 16 The mode is the item that occurs the most often in a data set. If we organise this data will be easy to find the number of students that occurs most frequently. 12 13 13 14 15 15 15 16 16 17 18 The mode is 15. www.mathssupport.org
The mean The mean is the most commonly used average. To calculate the mean of a set of values we add together the values and divide by the total number of values. Sum of values Number of values Mean = We denote the mean for an entire population by , which we read as mu In many cases we do not have data for all the population, and so the exact value of is unknown. Instead, we obtain data from a sample of the population and use the mean of the sample, x, as an approximation for The mean of the sample n xi i=1 x1 + x2 + x3+ . + xn x = = n n www.mathssupport.org
The mean This is the number of students in each class of a school, find the mean. 13 12 15 13 18 14 16 15 15 17 16 Sum of values Number of values Mean = + + + + + + + + + + 13 12 15 13 18 14 16 15 15 17 16 x = 11 164 11 x = = 14.9 The mean is 14.9 www.mathssupport.org
The median The median is the middle number when all numbers are in order. Calculate the median of students in each class of the school. 13 12 15 13 18 14 16 15 15 17 16 Write the results in order and find the middle value: 12 13 13 14 15 15 15 16 16 17 18 The median is 15. www.mathssupport.org
The median For an odd number of data, the media is one of the original data values. For an even number of data, the media is the average of the two middle values and may not be in the original set. n + 1 2 . The median is If there are n data values, find the data value th n + 1 ) 2 ( There are 100 numbers in a list. Where is the median? 101 2 = 50.5th number in the list (halfway between the 50th and the 51st). There are 37 numbers in a list. Where is the median? 38 2 = 19th number in the list. www.mathssupport.org
Measuring the centre This is the number of questions answered in a 10 questions-maths test by 15 students. 3 6 5 7 7 4 6 5 6 7 6 8 10 7 8 (a) find the mean. Sum of values Number of values Mean = + + + + + + + + + + + + + + 7 3 6 5 7 4 6 5 6 7 6 5 6 7 6 x = 15 86 15 x = = 5.73 The mean is 5.73 www.mathssupport.org
Measuring the centre This is the number of questions answered in a 10 questions-maths test by 15 students. 3 6 5 7 7 4 6 5 6 7 6 8 10 7 8 (b) find the median. Write the results in order and find the middle value: 1 2 3 4 5 6 7 8 8 8 10 3 4 5 5 6 6 6 6 7 7 7 7 To calculate in what position the median will be n + 1 2 16 2 15 + 1 2 = 8 = = The median is 6 www.mathssupport.org
Measuring the centre This is the number of questions answered in a 10 questions-maths test by 15 students. 3 6 5 7 7 4 6 5 6 7 6 8 10 7 8 (c) find the mode. With the results in order, we can find the most repeated value: 8 8 3 10 4 5 5 6 6 6 6 7 7 7 7 6 and 7 both occur four times, so the data is bimodal. The modes are 6 and 7 www.mathssupport.org
Thank you for using resources from A close up of a cage Description automatically generated For more resources visit our website https://www.mathssupport.org If you have a special request, drop us an email info@mathssupport.org www.mathssupport.org