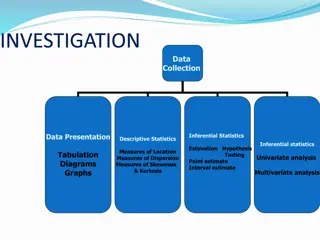
Understanding Measures of Central Tendency in Statistics

Measures of central tendency, such as mean, median, and mode, play a crucial role in statistical analysis by describing the central position in a dataset. Mean represents the average, median is the middlemost value, while mode is the most frequent value. Learn about their significance, calculation methods, and types of means. These measures help provide insight into the distribution characteristics of data sets.

Download Presentation

Please find below an Image/Link to download the presentation.
The content on the website is provided AS IS for your information and personal use only. It may not be sold, licensed, or shared on other websites without obtaining consent from the author. Download presentation by click this link. If you encounter any issues during the download, it is possible that the publisher has removed the file from their server.
E N D
Presentation Transcript
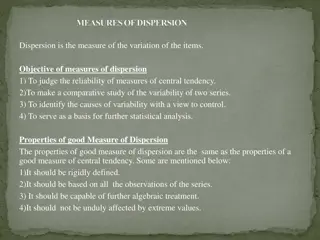
A measure of central tendency is a single value that tries to explain a set of data by recognising the central position in that set of data. Measures of central tendency are sometimes also known as measures of central location. They are also categorised as summary statistics. The three most common measures of central tendency in statistics are mean, median, and mode.
The central tendency is said to be the statistical model that represents the single value of the entire distribution or database and aims to implement an exact description of the entire data in the distribution. There are three main measures of central tendency are- Mean,Median and Mode.
MEAN Mean is an approach that is generally used in statistics. At our school level, we learned the theory behind the average calculation. However, in higher levels, we are introduced to the topic called mean. Mean is a fundamental concept in mathematics and statistics.In statistics,it is defined as the measure of the central tendency of a probability distribution with median and mode. It is also recognized as the expected value. Mean = (Sum of all the observations/Total number of observations)
There are majorly 3 distinct types of mean value that you will find in statistics. Arithmetic Mean Geometric Mean Harmonic Mean
MEDIAN The data of the middlemost observation that is achieved after modifying the data in ascending order is termed the median of the data. The advantage of applying the median as a central tendency is that it is less influenced by outliers and skewed data. Median is determined for ungrouped data as well as ungrouped data. The formula for the ungrouped data is divided into two categories:
If the data set holds an odd number of values i.e n=odd,then the median is given by the formula. If the dataset holds an even number of data values i.e n = even, the median is computed by the formula.
The formula to calculate the median of grouped data is: For the above formula; l is the lower limit of the median class, f denotes the frequency of the median class, h is the width of the median class, cf denotes the cumulative frequency of the class preceding the median class.
MODE The median is the middle character in a data set when the numbers are presented in ascending or descending order. Whereas the mode is the value that happens to appear most often in a data set and the range is the difference between the highest and lowest values in a data set. The general formula for mode calculation of grouped data is:
Here; l = lower limit of modal class; fm = frequency of modal class; f1 = frequency of class preceding modal class; f2 = frequency of class succeeding modal class and h = class width.
RELATIONSHIP BETWEEN MEAN, MEDIAN AND MODE The three measures of central values i.e. mean, median and mode are closely correlated by the following relations, also called an empirical relationship. 2 Mean + Mode = 3 Median Or Mode = 3 Median 2 Mean