Understanding Robust Estimation Methods for Handling Outliers in Data Analysis
This content delves into the importance of robust estimation in dealing with outliers in data analysis. It covers topics such as moving averages, the impact of outliers, reasons for outlier occurrence, and the robustness of median compared to mean calculations. Additionally, it explores moving median versus moving mean calculations and discusses the use of Gaussian noise.

Download Presentation

Please find below an Image/Link to download the presentation.
The content on the website is provided AS IS for your information and personal use only. It may not be sold, licensed, or shared on other websites without obtaining consent from the author. Download presentation by click this link. If you encounter any issues during the download, it is possible that the publisher has removed the file from their server.
E N D
Presentation Transcript
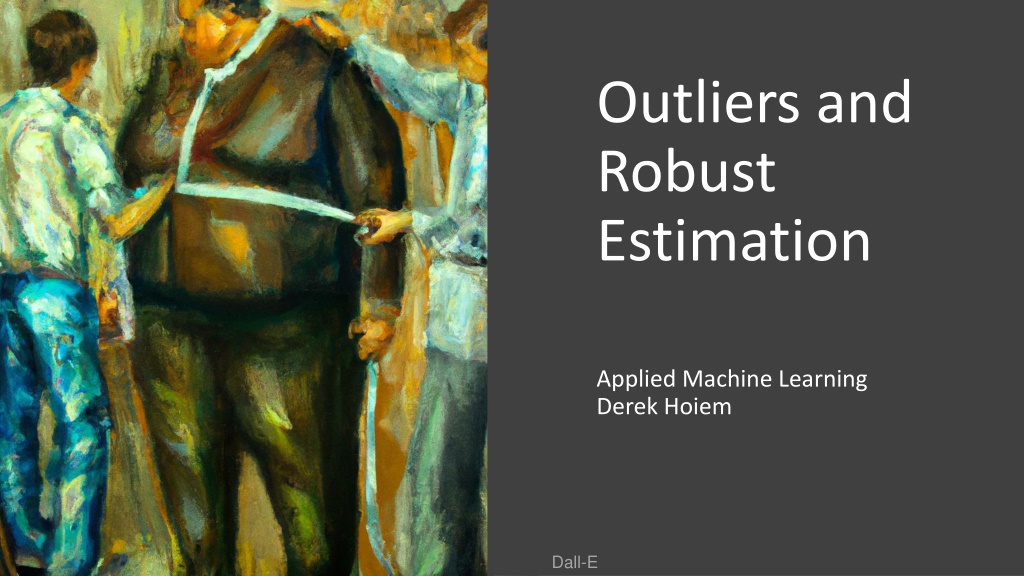
Outliers and Robust Estimation Applied Machine Learning Derek Hoiem Dall-E
This class: Robust Estimation Robust statistics and quantiles Detecting outliers Robust fitting Reweighted least squares RANSAC
Moving average Compute the mean value of data within a window Example: moving average with 3-size window 1 2 3 3 2 1 1 2 3 2 8/3 8/3 2 4/3 ? 2 (1+1+2)/3=4/3 Sinusoidal signal (200 points) 11-element window for moving average
Moving average Moving average is robust to random additive noise Noisy signal = clean signal + noise If noise has zero mean, then it gets averaged out Sinusoidal signal + 0.2 stdev noise (200 points) 11-element window for moving average
Moving average Moving average is not robust to outliers because these can pull the average far in one direction Sinusoidal signal w/ 5% outliers (replaced with 1) 11-element window for moving average
Why are outliers common? Simple noise can sometimes lead to majorly wrong values E.g. in estimating point clouds, slight errors in estimating corresponding pixels can lead to large errors in 3D point estimates Data may have missing values that are filled with constants E.g. unknown salaries may be filled with 0 Data may have incorrectly entered values E.g. some salaries are entered in thousands or some entries had typos Naturally occurring processes are not fully modeled E.g. stocks could split or merge, or a company could go bankrupt, leading to misleading or exceptional price changes Sensors may be occasionally blocked by another object, or briefly output erroneous values Values could be correct but non-representative E.g. average net worth of Harvard drop-outs is very high due to Bill Gates ($110B), Mark Zuckerburg ($79B), and Bom Kim ($2.8B)
Median is more robust Moving median: return median within each window Mean(1, 2, 7)=3 Median(1, 2, 7) =2 Mean(1, 2, 96) = 33 Median(1, 2, 96) = 2 data 1 2 3 3 2 1 1 2 3 mean 2 8/3 8/3 2 4/3 4/3 2 median 2 3 3 2 1 1 2 data 1 2 -50 3 2 1 200 2 3 203/3 203/3 205/3 47/3 mean 15 15 2 median 2 3 2 2 ? ? ? 2 2 3
Moving median vs. moving mean 5% Outlier noise Gaussian noise
Moving median vs. moving mean 10% outlier noise 25% outlier noise
Robust Min and Max Estimation 200 clean points in U(25, 75) + 20 outliers in U(0, 200) Min of range True: 25 Min data: 4 5th pct: 27 10th pct: 30 Max of range True: 75 Max data: 198 95th pct: 76 90th pct: 72
Robust Min and Max in clean data (min, 5th, 10th) = (25, 28, 30) (max, 95th, 90th) = (75, 72, 70)
Percentiles give consistent under- estimate of range when data is clean. Can we correct for this?
Robust Min and Max, Corrected Corrected by assuming that distribution is uniform, so e.g. max ? ??? ?,90 + ??? ?,90 ??? ?,10 0.1/0.8
Detecting outliers Outlier detection involves identifying which data points are distractors, not just robustly estimating statistics If we can detect and remove outliers, we can use any method for further analysis How might we detect outliers with PCA and/or Gaussian Mixture Model?
Detecting outliers: low probability data points Estimate 40 component diagonal GMM Find 20 lowest probability examples (only considering features, not labels)
Detect outliers: PCA Reconstruction Error Compress to 100 PCA coefficients Reconstruct, and measure reconstruction error Show examples with highest reconstruction error
Detect outliers: UMAP Embedding all (50,000 points), 100 neighbors, 200s
Identifying outliers based on density Based on neighborhood density: 1. Compute average density based on some samples, e.g. inverse density is average distance to K neighbors 2. If point has much lower density than its neighbors, it is an outlier Based on a radius: 1. Compute average number of points within some radius of another point 2. Any points that have much lower density than average are outliers Figs: https://towardsdatascience.com/density-based-algorithm-for-outlier-detection-8f278d2f7983
Robust estimation Fitting data with robustness to outliers
Least squares line fitting Data: (x1, y1), , (xn, yn) Line equation: yi = mxi + b Find (m, b) to minimize y=mx+b (xi, yi) = n = 2) ( E y m x b i i 1 i 2 1 x y 2 1 1 m m = = n 2 = = Ap y 1 E x y i i b b 1 i 1 x y n n = + T T T y y Ap y Ap Ap ( 2 ) ( ) ( ) dE = = T T A Ap A y 2 2 0 dp ( ) 1 = = T T T T A Ap A y p A A A y Modified from S. Lazebnik
Robust least squares (to deal with outliers) General approach: minimize ( ( ) ) i = n , ; u x = 2 2 ( ) u y m x b i i i i 1 i ui (xi, ) residual of ith point w.r.t. model parameters robust function with scale parameter The robust function Favors a configuration with small residuals Constant penalty for large residuals Slide from S. Savarese
Robust Estimator 1. Initialize: e.g., choose ? by least squares fit and median 5 . 1 = ( ) error 2 ( , ) error 2 data , ( i i 2. Choose params to minimize: E.g., numerical optimization + 2 ) error data i ( ) 5 . 1 = median error 3. Compute new 4. Repeat (2) and (3) until convergence
Iteratively Reweighted Least Squares (IRLS) Goal solve an optimization involving a robust norm, e.g. ?=1 1. Initialize weights ? to 1 2. Solve for parameters ? that minimize weighed squared error 3. Assign new weights based on error
RANSAC (RANdom SAmple Consensus) : Fischler & Bolles in 81. Algorithm: 1. Sample (randomly) the number of points required to fit the model 2. Solve for model parameters using samples 3. Score by the fraction of inliers within a preset threshold of the model Repeat 1-3 until the best model is found with high confidence
RANSAC Line fitting example Algorithm: 1. Sample (randomly) the number of points required to fit the model (#=2) 2. Solve for model parameters using samples 3. Score by the fraction of inliers within a preset threshold of the model Repeat 1-3 until the best model is found with high confidence Illustration by Savarese
RANSAC Line fitting example Algorithm: 1. Sample (randomly) the number of points required to fit the model (#=2) 2. Solve for model parameters using samples 3. Score by the fraction of inliers within a preset threshold of the model Repeat 1-3 until the best model is found with high confidence
RANSAC Line fitting example = 6 N I Algorithm: 1. Sample (randomly) the number of points required to fit the model (#=2) 2. Solve for model parameters using samples 3. Score by the fraction of inliers within a preset threshold of the model Repeat 1-3 until the best model is found with high confidence
RANSAC = 14 N I Algorithm: 1. Sample (randomly) the number of points required to fit the model (#=2) 2. Solve for model parameters using samples 3. Score by the fraction of inliers within a preset threshold of the model Repeat 1-3 until the best model is found with high confidence
How to choose parameters? Number of samples N Choose N so that, with probability p, at least one random sample is free from outliers (e.g. p=0.99) (outlier ratio: e ) Number of sampled points s Minimum number needed to fit the model Distance threshold Choose so that a good point with noise is likely (e.g., prob=0.95) within threshold Zero-mean Gaussian noise with std. dev. : t2=3.84 2 ( 1 ) proportion of outlierse 20% 25% 5 6 7 9 9 13 12 17 16 24 20 33 26 44 ( ) ( ) s = N log 1 p / log 1 e s 2 3 4 5 6 7 8 5% 2 3 3 4 4 4 5 10% 3 4 5 6 7 8 9 30% 7 11 17 26 37 54 78 40% 11 19 34 57 97 163 272 50% 17 35 72 146 293 588 1177 Advanced algorithms automatically find N and modified from M. Pollefeys
RANSAC conclusions Good Robust to outliers Advanced forms can automatically estimate thresholds and number of iterations Bad Computational time grows quickly with fraction of outliers and number of parameters
Things to remember Median and quantiles are robust to outliers, while mean/min/max aren t Outliers can be detected as low probability points, low density points, poorly compressible points, or through 2D visualizations Least squares is not robust to outliers. Use RANSAC or IRLS or robust loss function instead.
Next class Decision trees


")

")