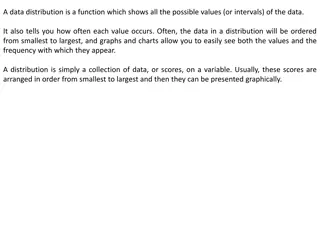
Understanding Fair Distribution of Sweets: Analysis & Comparison
Explore the concept of fair distribution through sweets, assessing mean, median, and variability. Engage in activities to make distributions fair by moving items and determining the most equitable distribution among different scenarios. Analyze various distributions of sweets among students and identify the fairest arrangement based on median, moves needed, and mean values.

Download Presentation

Please find below an Image/Link to download the presentation.
The content on the website is provided AS IS for your information and personal use only. It may not be sold, licensed, or shared on other websites without obtaining consent from the author. Download presentation by click this link. If you encounter any issues during the download, it is possible that the publisher has removed the file from their server.
E N D
Presentation Transcript
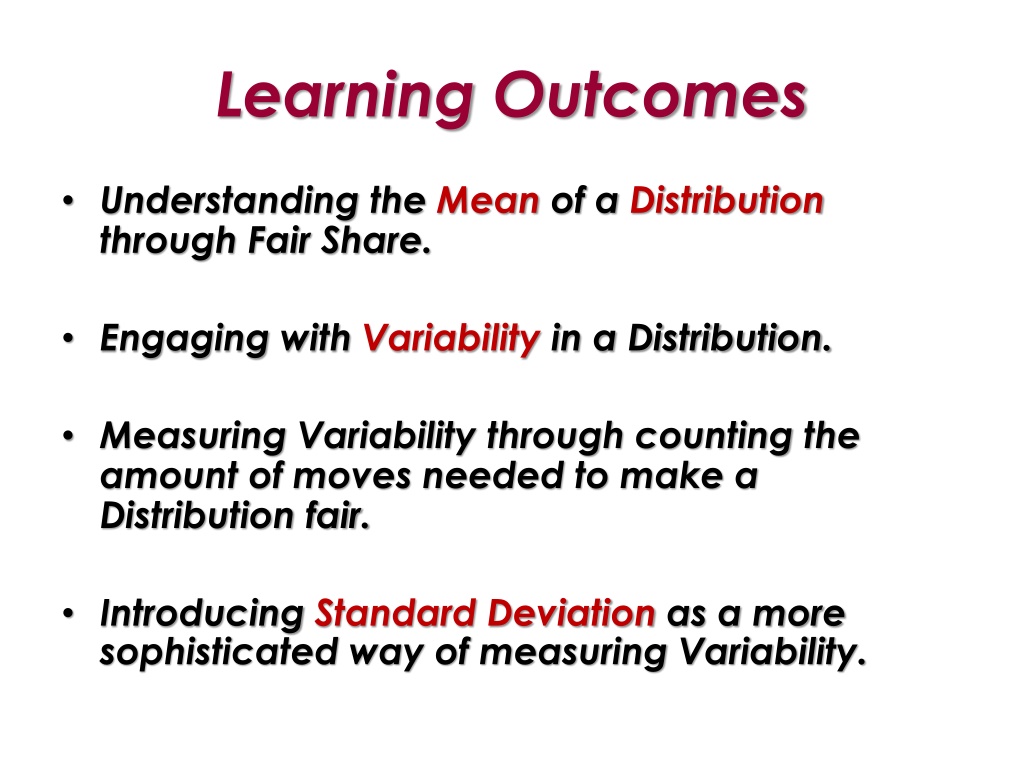
Learning Outcomes Understanding the Mean of a Distribution through Fair Share. Engaging with Variability in a Distribution. Measuring Variability through counting the amount of moves needed to make a Distribution fair. Introducing Standard Deviation as a more sophisticated way of measuring Variability.
Key Words Distribution Fair Unfair Mean Variability Spread of a Distribution
The following represents a distribution of 45 sweets shared among 9 students. Is this a fair distribution of the sweets?
Lets make it fair. We need to move around some sweets. How many times will we need to move a sweet to make it fair?
How many moves? 6 moves How many sweets are in a Fair Share? 5 sweets We say The Mean of the distribution is 5 3 moves 1 move 2 moves
Recap: In the below Distribution of Sweets A Fair Share/Mean = 5 No of Moves to make it fair = 6 Median = 5
Here are 6 more Distributions of the 45 sweets 1 2 3 4 5 6 7 8 9 Ranking Median Moves Mean 6 5 5 4 5 5 6 5 4 A 1 10 10 1 1 10 1 10 1 B 2 4 8 3 4 6 6 7 5 C 4 4 7 4 4 5 6 7 4 D 1 4 8 4 4 6 6 8 4 E 8 1 7 7 4 1 3 7 7 F Each row totals 45
Which one looks like the most fair distribution? 1 2 3 4 5 6 7 8 9 Ranking Median Moves Mean 6 5 5 4 5 5 6 5 4 A 1 10 10 1 1 10 1 10 1 B 2 4 8 3 4 6 6 7 5 C 4 4 7 4 4 5 6 7 4 D 1 4 8 4 4 6 6 8 4 E 8 1 7 7 4 1 3 7 7 F Each row totals 45
Set A With your unifix cubes find The Mean/Fair Share of the Distribution. Find how many Moves it takes to make set A fair. Find the Median of the Distribution.
Set A Set B Set C Set D Mean/Fair Share = 5 Moves to make fair = 2 Median = 5 Set E Set F
Which one looks like the most unfair distribution? 1 2 3 4 5 6 7 8 9 Ranking Median Moves Mean 6 5 5 4 5 5 6 5 4 A 1 10 10 1 1 10 1 10 1 B 2 4 8 3 4 6 6 7 5 C 4 4 7 4 4 5 6 7 4 D 1 4 8 4 4 6 6 8 4 E 8 1 7 7 4 1 3 7 7 F Each row totals 45
Set B Why is Set B most unfair? Because there is a lot more Variability in the Distribution of the sweets
Set B With your unifix cubes find the Mean, the Moves and the Median of Set B. I wonder will the answers be different because there is a lot more Variability in the Spread of Set B ????
Set A Set B Set C Set D Mean/Fair Share = 5 Moves to make fair = 20 Median = 1 Set E Set F
How do we think the number of moves might be affected by the variability in a Distribution? Discuss The more variability in a distribution, the more moves it takes to make it fair
Find the Median, Moves & Mean for C, D, E, F 1 2 3 4 5 6 7 8 9 Ranking Median Moves Mean 6 5 5 4 5 5 6 5 4 A 1 10 10 1 1 10 1 10 1 B 2 4 8 3 4 6 6 7 5 C 4 4 7 4 4 5 6 7 4 D 1 4 8 4 4 6 6 8 4 E 8 1 7 7 4 1 3 7 7 F Each row totals 45
Answers 1 2 3 4 5 6 7 8 9 Ranking Median Moves Mean 1 6 5 5 4 5 5 6 5 4 A 6 1 10 10 1 1 10 1 10 1 B 3 2 4 8 3 4 6 6 7 5 C 2 4 4 7 4 4 5 6 7 4 D 4 1 4 8 4 4 6 6 8 4 E 5 8 1 7 7 4 1 3 7 7 F Each row totals 45
Answers 1 2 3 4 5 6 7 8 9 Ranking Median Moves Mean 1 5 6 5 5 4 5 5 6 5 4 A 6 1 1 10 10 1 1 10 1 10 1 B 3 5 2 4 8 3 4 6 6 7 5 C 2 4 4 4 7 4 4 5 6 7 4 D 4 4 1 4 8 4 4 6 6 8 4 E 5 7 8 1 7 7 4 1 3 7 7 F Each row totals 45
Answers 1 2 3 4 5 6 7 8 9 Ranking Median Moves Mean 2 1 5 6 5 5 4 5 5 6 5 4 A 20 6 1 1 10 10 1 1 10 1 10 1 B 7 3 5 2 4 8 3 4 6 6 7 5 C 5 2 4 4 4 7 4 4 5 6 7 4 D 8 4 4 1 4 8 4 4 6 6 8 4 E 11 5 7 8 1 7 7 4 1 3 7 7 F Each row totals 45
Answers 1 2 3 4 5 6 7 8 9 Ranking Median Moves Mean 2 1 5 5 6 5 5 4 5 5 6 5 4 A 20 6 1 5 1 10 10 1 1 10 1 10 1 B 7 3 5 5 2 4 8 3 4 6 6 7 5 C 5 2 4 5 4 4 7 4 4 5 6 7 4 D 8 4 4 5 1 4 8 4 4 6 6 8 4 E 11 5 7 5 8 1 7 7 4 1 3 7 7 F Each row totals 45
Do the mean and median always have to be the same in a Distribution? Discuss
Looking at our Distributions.. The number of moves gives us a Measure of the Variability in the Spread of the Distribution
Set A 2 moves Set B Set C See how the spread looks when the sweets are represented on a Dot Plot Set D Set E Set F
Set A 20 moves Set B Set C Set D Set E Set F
7 Set A moves Set B Set C Set D Set E Set F
Set A 5 moves Set B Set C Set D Set E Set F
Set A 8 moves Set B Set C Set D Set E Set F
Set A 11 moves Set B Set C Set D Set E Set F
A more sophisticated way of measuring variability or spread is Standard Deviation
Standard Deviation = 2 ( x ) n = 2.049
Standard Deviation using Calculator Use your calculator to calculate the standard deviation of the various sets given in the table.
Unfair Allocations 1 2 3 4 5 6 7 8 9 Ranking Median Moves Mean S.D. 2 1 5 5 0.67 6 5 5 4 5 5 6 5 4 A 20 6 1 5 4.47 1 10 10 1 1 10 1 10 1 B 7 3 5 5 1.83 2 4 8 3 4 6 6 7 5 C 5 2 4 5 1.25 4 4 7 4 4 5 6 7 4 D 8 4 4 5 2.11 1 4 8 4 4 6 6 8 4 E 11 5 7 5 2.62 8 1 7 7 4 1 3 7 7 F Each row totals 45