Exploratory Data Analysis and Descriptive Statistics in Statistical Analysis
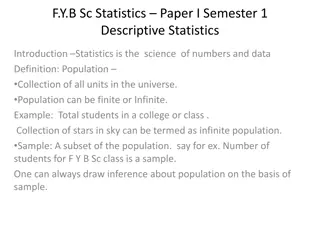
Exploratory Data Analysis involves understanding data characteristics through visualization techniques like bar graphs, pie charts for qualitative data and histograms, scatterplots for quantitative data. It includes calculating mean, median for center, range, standard deviation for spread, and identifying outliers based on interquartile range. Descriptive statistics help in interpreting data patterns before delving into inferential statistics for deeper analysis.

Download Presentation

Please find below an Image/Link to download the presentation.
The content on the website is provided AS IS for your information and personal use only. It may not be sold, licensed, or shared on other websites without obtaining consent from the author. Download presentation by click this link. If you encounter any issues during the download, it is possible that the publisher has removed the file from their server.
E N D
Presentation Transcript
EXPLORATORY DATA ANALYSIS and DESCRIPTIVE STATISTICS
means to DESCRIBE & UNDERSTAND THIS DATA S CHARACTERISTICS before you analyze this data
this is part of EXPLAINING INFERENTIAL STATISTICS
Exploratory Data Analysis NOMINAL / ORDINAL (qualitative / categorical) DATA bar graphs, pie charts INTERVAL / RATIO (quantitative) DATA histograms, time plots, scatterplots CENTER of the data calculate and compare mean and median SPREAD of the data calculate range and standard deviation DISTRIBUTION (or shape) of the data symmetric / bell shaped? skewed to the right/left? etc. OUTLIERS [extreme] 3 Interquartile Range above 3rd or below 1st quartile [moderate] 1.5 (IQR) above 3rd or below 1st quartile
Interpreting Graphs direction (+ slope = direct relationship & slope = inverse relationship) form (linear or curved) the spread or variability of the measurements represents the strength of correlation (R2) between X and Y the slope (b) of a regression line represents the rate of change in y as x changes