Understanding Measures of Central Tendency in Math
In mathematics, the average, median, mode, and range are essential measures of central tendency used to organize and summarize data for better understanding. The mean refers to the middle value of a dataset without outliers, while the median is the middle number when the data is ordered. The mode represents the most common value in a dataset, and the range simply calculates the difference between the largest and smallest numbers. Learning these concepts helps in analyzing data effectively.
Download Presentation

Please find below an Image/Link to download the presentation.
The content on the website is provided AS IS for your information and personal use only. It may not be sold, licensed, or shared on other websites without obtaining consent from the author. Download presentation by click this link. If you encounter any issues during the download, it is possible that the publisher has removed the file from their server.
E N D
Presentation Transcript
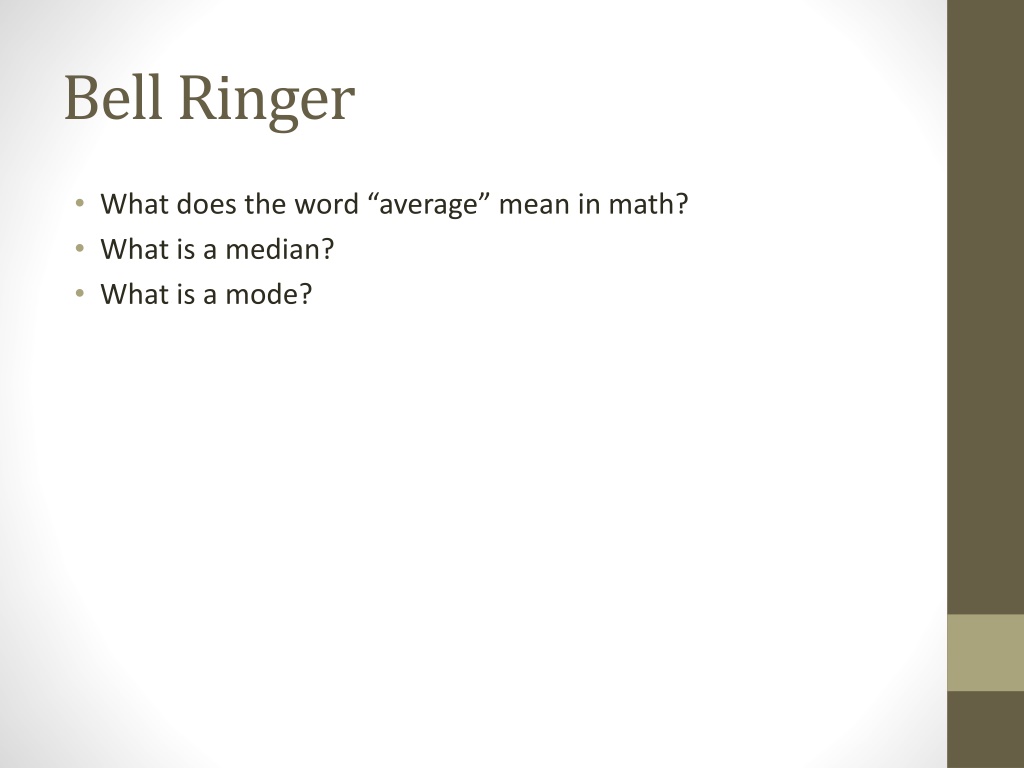
Bell Ringer What does the word average mean in math? What is a median? What is a mode?
Mean, Median, Mode, and Range Mr. Haupt CC2.2.HS.D.1
Measure of central tendency Mean, median, and mode are all part of what is called the measures of central tendency. They are all ways that we can organize and summarize data, so that we can understand it.
Mean The mean is used to describe the middle of a set of data that does NOT have an outlier. An outlier is a data value that is way higher or way lower than the other data values. So, if most of your values are between 2 and 12, and then one value is 138, that is an outlier. Why can you not do the mean with an outlier? To find the mean, you add all the data items, and then divide by the total number of data items.
Example #1 Find the mean of: 12, 15, 23, 19, 9, 16, 18, 24
Median The median is the middle number of a data set when the data are put in order. If the median is two numbers, find the mean of those numbers. Think of it like a road median. It is in the middle of the road.
Example #2 Find the median: 12, 24, 13, 18, 16, 10, 25
Mode Mode is the most common data value in a set. There can be no mode, one mode, or multiple modes.
Example #3 Find the mode: 12, 17, 9, 8, 11, 8, 5, 9, 15, 18, 7, 13
Range The range of a set of data is simply the largest number minus the smallest number.
Example #4 Find the range: 100, 98, 151, 88, 125, 164, 101, 99
Interquartile Range Lower quartile and upper quartile Lower Quartile Find the median of the lower half of the number set Upper Quartile Find the median of the upper half of the number set.
Box and Whisker Plots Box and whisker plots are graphs that summarize a data set using a number line. There is a box in the middle, and whiskers off the sides. The box uses the median, lower quartile, and upper quartile. The whiskers use the minimum and maximum.
Example #5 Make a box and whisker plot: 12, 24, 32, 25, 26, 16, 10, 27, 18, 13, 20
