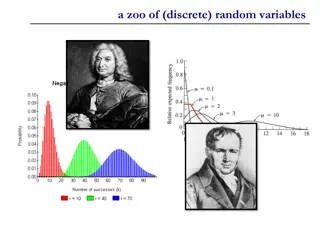
Understanding Continuous Random Variables in Statistics
Learn about continuous random variables in statistics, where we analyze the probability distribution of variables to calculate probabilities, determine mean and median locations, and draw normal probability distributions. Explore examples like ITBS scores and enemy appearance in video games to understand how density curves describe the probability distribution of these variables.

Download Presentation

Please find below an Image/Link to download the presentation.
The content on the website is provided AS IS for your information and personal use only. It may not be sold, licensed, or shared on other websites without obtaining consent from the author. Download presentation by click this link. If you encounter any issues during the download, it is possible that the publisher has removed the file from their server.
E N D
Presentation Transcript
Random Variables Lesson 5.5 Continuous Random Variables Statistics and Probability with Applications, 3rdEdition Starnes & Tabor Bedford Freeman Worth Publishers
Continuous Random Variables Learning Targets After this lesson, you should be able to: Show that the probability distribution of a continuous random variable is valid and use the distribution to calculate probabilities. Determine the relative locations of the mean and median of a continuous random variable from the shape of its probability distribution. Draw a normal probability distribution with a given mean and standard deviation. Statistics and Probability with Applications, 3rdEdition 2 2
Continuous Random Variables Below is a relative frequency histogram of the scores of all seventh- grade students in Gary, Indiana, on the vocabulary part of the Iowa Test of Basic Skills (ITBS). The scores are grade-level equivalents. So a score of 6.3 indicates that the student s performance is typical for a student in the third month of grade 6. The histogram is roughly symmetric, and both tails fall off smoothly from a single center peak. There are no large gaps or obvious outliers. Suppose that we choose a Gary seventh-grader at random. Let X = the student s ITBS vocabulary score. Statistics and Probability with Applications, 3rdEdition 3 3
Continuous Random Variables What s P(X< 6.0)? It s the probability that a randomly selected student earned a vocabulary score less than the sixth-grade equivalent on the ITBS test. The area of the shaded bars in the relative frequency histogram in (a) represents the proportion of students with vocabulary scores less than 6.0. The smooth curve drawn through the tops of the histogram bars in (b) is a good description of the overall pattern of the distribution. We call this curve a density curve. Statistics and Probability with Applications, 3rd Edition 4 4
Continuous Random Variables Density Curve The probability distribution of a continuous random variable is described by a density curve, a curve that is always on or above the horizontal axis, and has an area of exactly 1 underneath it. Statistics and Probability with Applications, 3rd Edition 5 5
When will an enemy appear? When will an enemy appear? Continuous random variables and density curves Continuous random variables and density curves PROBLEM: Suppose that a timer for a video game has a randomly determined length of time, after which an enemy appears. Let X = the length of time until an enemy appears. The probability distribution is shown as a density curve in the following figure. (a) Explain why the probability distribution of X is valid. (b) Find and interpret P(X < 1). Statistics and Probability with Applications, 3rd Edition 6 6
When will an enemy appear? When will an enemy appear? Continuous random variables and density curves Continuous random variables and density curves (a) Explain why the probability distribution of X is valid. The density curve is entirely above the horizontal axis and the area under the density curve is 1. (b) Find and interpret P(X < 1). The height of the density curve above 1 is 0.5. So, area = 0.5 = 0. 25. There is a 25% chance that an enemy takes less than 1 minute to appear. base height = 2 1 = 1 Statistics and Probability with Applications, 3rd Edition 7 7
Continuous Random Variables Recall that the mean is the balance point of a distribution. This figure illustrates this idea for the mean of a continuous random variable. Areas under a density curve represent probabilities. The median of a continuous random variable is the 50th percentile of its probability distribution. Mean and Median of a Continuous Random Variable The mean of a continuous random variable is the point at which its probability distribution would balance if made of solid material. The median of a continuous random variable is the equal-areas point, the point that divides the area under the probability distribution in half. Statistics and Probability with Applications, 3rd Edition 8 8
Continuous Random Variables The median of a symmetric probability distribution is at its midpoint. A symmetric density curve balances at its midpoint because the two sides are identical. So the mean and median of a continuous random variable with a symmetric probability distribution are equal. It isn t so easy to spot the equal-areas point on a skewed probability distribution. In a right skewed distribution, the mean is greater than the median because the balance point of the distribution is pulled toward the long right tail. Statistics and Probability with Applications, 3rd Edition 9 9
Is it left skewed, too? Is it left skewed, too? Mean versus median Mean versus median PROBLEM: The probability distribution of a continuous random variable is shown. Identify the location of the mean and median by letter. Justify your answers. This density curve is skewed to the left. Median = B, Mean = A. B is the equal-areas point of the distribution. The mean (balance point of the distribution) will be less than the median due to the left-skewed shape. Statistics and Probability with Applications, 3rd Edition 10 10
Continuous Random Variables Normal Distribution A normal distribution is described by a symmetric, single-peaked, bell-shaped density curve. Any normal distribution is completely specified by two numbers: its mean and standard deviation . All normal distributions have the same overall shape: symmetric, single-peaked, and bell-shaped. The mean is located at the midpoint of the symmetric density curve and is the same as the median. The standard deviation measures the variability (width) of a normal distribution. Statistics and Probability with Applications, 3rd Edition 11 11
Can this truck stop on a dime? Can this truck stop on a dime? Graphing a normal distribution Graphing a normal distribution PROBLEM: Many studies on automobile safety suggest that when drivers of automobiles need to make emergency stops, the stopping distances follow an approximately normal distribution. Suppose that for one pickup truck traveling at 62 mph under typical conditions on dry pavement, the mean stopping distance is = 155 ft, with a standard deviation of = 3 ft. Sketch the probability distribution of X = the stopping distance for a randomly selected emergency stop. Label the mean and the points that are 1, 2, and 3 standard deviations from the mean. 146 149 152 155 158 161 164 Stopping distance Statistics and Probability with Applications, 3rd Edition 12 12
LESSON APP 5.5 Still waiting for the server? How does your Web browser get a file from the Internet? Your computer sends a request for the file to a Web server, and the Web server sends back a response. For one particular Web server, the time X (in seconds) after the start of an hour at which a randomly selected request is received has the uniform distribution shown in the figure. 1. What height must the probability distribution have? Justify your answer. Find the probability that the request is received within the first 300 seconds (5 minutes) after the hour. What is the mean of X ? Explain. What is the median of X ? Explain. 2. 3. 4. Statistics and Probability with Applications, 3rd Edition 13 13
LESSON APP 5.5 1. What height must the probability distribution have? Justify your answer. Still waiting for the server? 2. Find the probability that the request is received within the first 300 seconds (5 minutes) after the hour. Statistics and Probability with Applications, 3rd Edition 14 14
LESSON APP 5.5 3. What is the mean of X ? Explain. Still waiting for the server? 4. What is the median of X ? Explain. Statistics and Probability with Applications, 3rd Edition 15 15
Continuous Random Variables Learning Targets After this lesson, you should be able to: Show that the probability distribution of a continuous random variable is valid and use the distribution to calculate probabilities. Determine the relative locations of the mean and median of a continuous random variable from the shape of its probability distribution. Draw a normal probability distribution with a given mean and standard deviation. Statistics and Probability with Applications, 3rd Edition 16 16