Understanding Measures of Central Tendency in Statistics

Measures of central tendency, such as mean, median, and mode, provide a way to find the average or central value in a statistical series. These measures help in simplifying data analysis and drawing meaningful conclusions. The arithmetic mean, median, and mode are commonly used to represent the overall picture of a dataset, allowing for a clearer understanding of the field under study. The mean, in particular, is calculated by adding all data points and dividing by the total number of data points, making it a widely used measure due to its simplicity and stability. Explore further to grasp the essence of central tendency in statistics.

Download Presentation

Please find below an Image/Link to download the presentation.
The content on the website is provided AS IS for your information and personal use only. It may not be sold, licensed, or shared on other websites without obtaining consent from the author. Download presentation by click this link. If you encounter any issues during the download, it is possible that the publisher has removed the file from their server.
E N D
Presentation Transcript
Central Tendency in Statics by Dr. Deepali nigam Assistant Professor Department of Physical Education, Mahila Mahavidyalaya (P. G.) Kidwai Nagar, Kanpur
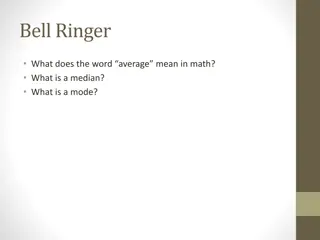
Measures of Central Tendency Measures of central tendency are a combination of two words i.e. measure and Central tendency . Measure means methods and Central Tendency means average value of any statistical series. Thus we can say that central tendency means the methods of finding out the central value or average value of a statistical series of quantitative information. According to Clark Average is an attempt to find one single figure to describe whole of figure. (https://www.yourarticlelibrary.com/)
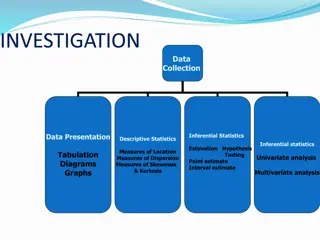
Uses and Measures of Central Tendency Central Tendency or Average provides the overall picture of the series. We cannot remember each and every facts relating to a field of enquiry, it also provides a clear picture about the field under study for guidance and necessary conclusion. There are three measures of central tendency.. The Arithmetic Mean. 1. 2. The Median and 3. The Mode.
The Mean The mean is the average of the data. Commonly , Average means the Arithmetic mean. It is most popularly used because of its simplicity, rigidity etc. The "average" number; found by adding all data points and dividing by the number of data points. II.E. Garett (1985 P) defines The arithmetic mean or more simply the mean is the sum of the separate scores or measures divided by their number. Direct method for calculating mean Formula: M= X/N Where: M=Mean, =Sum total of scores, X=Scores, N= Total No. of Scores Mean is more stable than the median and mode. So that when the measure of central tendency having the greatest stability is wanted mean is used.
Example to find the Mean (M) Find the mean from un-group data: 1,2,4,6,7 1stStep=Add the Scores=1+2+4+6+7=20 2ndStep=Total no. of Data Point=5 The Mean (M)=M= X / N = 20 / 5 = 4 So the Mean is 4, M=4
Example to find the Mean (M) Find the mean from grouped data by the following Formula: M= fX/N Where M=Mean, =Sum total of scores, f=Total no. of the distribution X=Scores N= Total No. of Scores Scores Frequencies (f) Total of Scores (X) fX 0-9 6 5 30 10-19 5 15 75 20-29 8 25 200 30-39 2 35 70 40-49 5 45 225 50-59 6 55 330 60-70 6 65 390 38 1320 M= fX/N, = 1320 / 38 = 34.74 So the Mean (M) is=34.74
The Median Median may be defined as a point on the distribution below which fifty percent cases and above which fifty percent cases lie. To find the median: 1) Arrange the data points from smallest to largest. 2) If the number of data points is odd, the median is the middle data point in the list. 3) If the number of data points is even, the median is the average of the two middle data points in the list. EXAMPLES=THE MEDIAN FROM UN-GROUP DATA Example 1=The median of 4, 1, and 7 is 4 because when the numbers are put in order (1,4,7), the number 444 is in the middle. Example:2= The median of 4, 1, 2and 7 is 4 because when the numbers are put in order (1,2,4,7), the Median is the average of the middle two data points i.e. 2+4/2=3 Uses of Median: Median is used when the exact midpoint of the distribution is needed or the 50% point is wanted.
EXAMPLE=THE MEDIAN FROM UN-GROUP DATA The formula to find out median from grouped data Mdn= L + N / 2 F / fm X i, Where L = Lower limit of the Median Class. N/2 = Half of the total number of scores. F = Cumulative frequency of the class internal below the median class. fm = Frequency of the median class. i = Size of the class internals. Example: in the given Table, 38 students in a test. Scores Frequencies (f) C.f N/2 = 34/2 = 17 60-69 2 28 L=30, Because th N/2=17 is included in the cumulative frequency of 50-59 3 23 40-49 7 22 the class interval 30-39, and the lower value is 30. 30-39 8 20 F=14 The cumulative frequency below the mdn class. 20-29 7 14 fm=8 The exact frequency of the mdn class. 10-19 5 7 i = 10. Size of the class interval. 0-9 2 4 Now value in the Formula=Mdn= L + N / 2 F / fm X I 34 17+17-14/8 x 10= 20+3/8 x 2 = 20+.375 x 2= 20+0.75= 20.75 Median of the distribution is 20.75
The Mode The most frequent number that is, the number that occurs the highest number of times. Example: The following table represents the no. of goals scored by a player in 8 matches Match no. 1 2 3 4 5 6 7 8 No. of Wickets 1 1 2 2 4 3 1 2 It can be seen that 2 Goals were scored by the player frequently in different matches. Hence, the mode of the given data is 2 Example-1: The mode of {4, 2, 4, 3, 2, 2} is 2 because it occurs three times, which is more than any other number. Example-2: The mode of {4, 2, 4, 3, 2, 2,4} is 2 and 4 because Both occurs three times. Example-3: The mode of {2, 4, 5, 7, 8, 10} = no value or number in a data set appears more than once, then the set has no mode.
Mode of Grouped data Example: in a class of 40 students in physical education, out of 60 marks is tabulated as below. Calculate the mode. Ans: The maximum class frequency is 12 and the class interval corresponding to this frequency is 31 40. Thus, the modal class is 31 40. Marks Obtained No. of Students Lower limit of the modal class (l) = 31 10-20 5 Size of the class interval (h) = 10 21-30 10 Frequency of the modal class (f1) = 12 Frequency of the class preceding the modal class (f0) = 10 Frequency of the class succeeding the modal class (f2)= 8 Substituting these values in the formula we get; 31-40 12 41-50 8 51-60 5 Mode=


")
")