Analyzing Mean, Median, and Mode in School Data
Anne and Kate, two new students at the school, are analyzing their classmates' data to understand them better. Anne calculates averages of social media accounts, phone usage, and weekly spending, while Kate uses a stem-and-leaf diagram to analyze the number of people classmates talk to daily. Different aspects such as social media accounts, phone time, and weekly spending are examined for mean, median, mode, and range. Kate's data also includes inter-quartile range calculations. The students seek insights into their peers' lives to fit in better.

Download Presentation

Please find below an Image/Link to download the presentation.
The content on the website is provided AS IS for your information and personal use only. It may not be sold, licensed, or shared on other websites without obtaining consent from the author. Download presentation by click this link. If you encounter any issues during the download, it is possible that the publisher has removed the file from their server.
E N D
Presentation Transcript
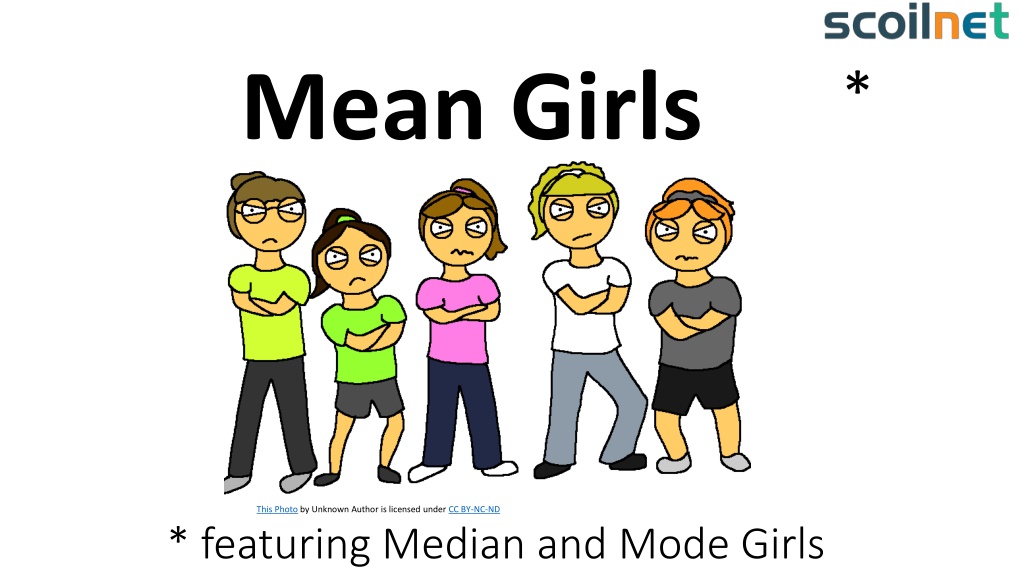
Mean Girls * This Photo by Unknown Author is licensed under CC BY-NC-ND * featuring Median and Mode Girls
Anne is desperate to fit in at her new school after years spent on the African plains with her zoologist parents and needs your help. She is analysing the lives of her classmates so she can get an idea of what makes them tick. She has decided to calculate averages of the most important aspects of their lives and asked them for the following information: Number of social media accounts. Time spent on the phone per day. Weekly spend. What needs What needs to be done? to be done?
Calculate the mean, median and Calculate the mean, median and mode of the following sets of data: mode of the following sets of data: A B C Social media accounts 5 2 Time spent on the phone yesterday (in minutes) Money spent last week (to the nearest ) D 3 E 5 F 3 G 4 H 6 I 5 J 4 7 78 66 75 103 94 36 77 48 65 118 23 29 45 15 30 27 29 15 36 22 Social media: Mean 4.4 Median 4.5 Mode 5 Time on phone: Mean 76 Median 76 Mode No mode Weekly spend: Mean 27.10 Median 28 Mode Bimodal
Kate has joined the school having travelled with her motor racing mechanic father around the world. A New Student A New Student At High School At High School Desperate to fit in she has compiled a stem-and- leaf diagram on the number of different people the members of her class talk to in a day. Can you help Kate analyse the data?
Kates stem Kate s stem- -and and- -leaf diagram: leaf diagram: Using Kate s stem-and-leaf diagram can you find the following: The number of girls in Kate s class. The largest number of people a classmate spoke to. The smallest number of people a classmate spoke to. The mean, median, mode and range of people spoken to. The inter-quartile range of Kate s data. 8 0 1 3 0 9 0 1 2 3 4 23 3 2 4 2 8 7 7 3 5 5 3 5 4 6 9 46 7 8 8 Mean: 26 Median: 27 Mode: 13 22 Key: 1 2 means 12 people