Introduction to Digital Geographic Data and Maps in GIS
Understanding digital maps and GIS involves recognizing their dynamic nature and the role of computing technology. Digital maps offer flexibility and scalability unlike traditional hardcopy maps. This introduction delves into the fundamental concepts of digital maps, emphasizing the storage of data on computers and the distinctions between data and information.
- Geographic Information Systems
- Digital Maps
- GIS Introduction
- Data and Information
- Computing Technology

Download Presentation

Please find below an Image/Link to download the presentation.
The content on the website is provided AS IS for your information and personal use only. It may not be sold, licensed, or shared on other websites without obtaining consent from the author. Download presentation by click this link. If you encounter any issues during the download, it is possible that the publisher has removed the file from their server.
E N D
Presentation Transcript
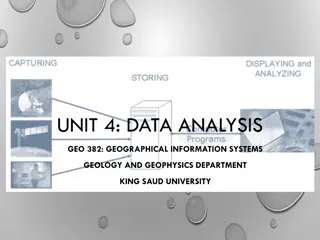
UNIT 2: DIGITAL GEOGRAPHIC DATA AND MAPS: PART 2 GEO 382: GEOGRAPHICAL INFORMATION SYSTEMS GEOLOGY AND GEOPHYSICS DEPARTMENT KING SAUD UNIVERSITY
INTRODUCTION To understand digital maps and mapping, it is necessary to put them into the context of computing and information technology. Unlike analog or hardcopy maps that are static or fixed once they are printed onto paper, digital maps are highly changeable, exchangeable, and are dynamic in terms of scale, form, and content. This provides an introduction to the building blocks of digital maps and geographic information systems (GISs), with particular emphasis placed upon how data and information are stored as files on a computer.
DATA AND INFORMATION To understand how we get from analog to digital maps, let s begin with the building blocks and foundations of the geographic information system (GIS) namely, data and information. As already noted on several occasions, GIS stores, edits, processes, and presents data and information. But what exactly is data? And what exactly is information? For many, the terms data and information refer to the same thing. For our purposes, it is useful to make a distinction between the two. Generally, data refer to facts, measurements, characteristics, or traits of an object of interest. Once data is used for answering questions, or used to obtain insights, they become information. For our purposes, information simply refers to the knowledge of value obtained through the collection, interpretation, and/or analysis of data.
DATA AND INFORMATION Though a computer is not necessary to collect, record, manipulate, process, or visualize data, or to process it into information, information technology can be of great help. For instance, computers can automate repetitive tasks, store data efficiently in terms of space and cost, and provide a range of tools for analyzing data from spreadsheets to GIS What s more is the fact that the incredible amount of data collected each and every day by satellites, grocery store product scanners, traffic sensors, temperature gauges, and your mobile phone carrier, to name just a few, would not be possible without the aid and innovation of information technology.
DATA AND INFORMATION Since this is a text about GISs, it is useful to also define geographic data. Like generic data, geographic or spatial data refer to geographic facts, measurements, or characteristics of an object that permit us to define its location on the surface of the earth. Data can be of two types: Geographic data and Attribute data. Where geographic data are concerned with defining the location of an object of interest, attribute data are concerned with its nongeographic traits and characteristics.
DATA AND INFORMATION To illustrate the distinction between geographic and attribute data, think about your home where you grew up or where you currently live. Within the context of this discussion, we can associate both geographic and attribute data to it. For instance, we can define the location of your home many ways, such as with a street address, the street names of the nearest intersection, the postal code where your home is located, or we could use a global positioning system enabled device to obtain latitude and longitude coordinates. What is important is geographic data permit us to define the location of an object (i.e., your home) on the surface of the earth.
DATA AND INFORMATION In addition to the geographic data that define the location of your home are the attribute data that describe the various qualities of your home. Such data include but are not restricted to the number of bedrooms and bathrooms in your home, whether or not your home has central air-conditioning, the year when your home was built, the number of people living in the house, and whether or not there is a swimming pool. These attribute data tell us a lot about your home but relatively little about where it is.
DATA AND INFORMATION Not only is it useful to recognize and understand how geographic and attribute data differ and complement each other, but it is also of central importance when learning about and using GISs. Because a GIS requires and integrates these two distinct types of data, being able to differentiate between geographic and attribute data is the first step in organizing your GIS. Furthermore, being able to determine which kinds of data you need will ultimately aid in your implementation and use of a GIS. More often than not, and in the age and context of information technology, the data and information discussed thus far is the stuff of computer files, which are the focus of the next section.
DATA FILES AND FORMAT When we collect data about your home, geology, or anything, really, we usually need to put them somewhere. Though we may scribble numbers and measures on the back of an envelope or write them down on a pad of paper, if we want to update, share, analyze, or map them in the future, it is often useful to record them in digital form so a computer can read them. Though we won t bother ourselves with the bits and bytes of computing, it is necessary to discuss some basic elements of computing that are both relevant and required when learning and working with a GIS.
DATA FILES AND FORMATS One of the most common elements of working with computers and computing itself is the file. filename.txt Simple text file filename.doc Microsoft Word document filename.pdfAdobe portable document format filename.jpg Compressed image file Files in a computer can contain any number of things from a complex set of instructions (e.g., a computer program) to a list of numbers and letters (e.g., address book). filename.tif filename.htmlHypertext markup language (used to create web pages) filename.xml Extensible markup language Tagged image format Furthermore, computer files come in all different sizes and types. One of the clues we can use to distinguish one file from another is the file extension. filename.zip Zipped/compressed archive The file extension refers to the letters that follow the period ( . ) after the name of the file.
DATA FILES AND FORMAT Some computer programs may be able to read or work with only certain file types, while others are more adept at reading multiple file formats. What you will realize as you begin to work more with information technology, and GISs in particular, is that familiarity with different file types is important. Learning how to convert or export one file type to another is also a very useful and valuable skill to obtain. In this regard, being able to recognize and knowing how to identify different and unfamiliar file types will undoubtedly increase your proficiency with computers and GISs.
DATA AND FORMAT Of the numerous file types that exist, one of the most common and widely accessed file is the simple text, plain text, or just text file. Simple text files can be read widely by word processing programs, spreadsheet and database programs, and web browsers. Often ending with the extension .txt (i.e., filename.txt), text files contain no special formatting (e.g., bold, italic, underlining) and contain only alphanumeric characters. In other words, images or complex graphics are not well suited for text files. Text files, however, are ideal for recording, sharing, and exchanging data because most computers and operating systems can recognize and read simple text files with programs called text editors.
DATA AND FORMAT When a text file contains data that are organized or structured in some fashion, it is sometimes called a flat file (but the file extension remains the same, i.e., .txt). Name Height Omar 6 1 Generally, flat files are organized in a tabular format or line by line. Ali 5 9 Abdullah 6 2 In other words, each line or row of the file contains one and only one record. So if we collected height measurements on three people, Omar, Ali, and Abdullah, the file might look something like this:
DATA AND FORMAT Each row corresponds to one and only one record, observation or case. There are two other important elements to know about this file. First, note that the first row does not contain any data; rather, it provides a description of the data contained in each column. Name Height Omar 6 1 When the first row of a file contains such descriptors, it is referred to as a header row or just a header. Ali 5 9 Columns in a flat file are also called fields, variables, or attributes. Height is the attribute, field, or variable that we are interested in, and the observations or cases in our data set are Omar, Ali, and Abdullah. Abdullah 6 2 In short, rows are for records; columns are for fields.
DATA AND FORMAT The second unseen but critical element to the file is the spaces in between each column or field. In the example, it appears as though a space separates the name column from the height column. Upon closer inspection, however, note how the initial values of the height column are aligned. If a single space was being used to separate each column, the height column would not be aligned. In this case a tab is being used to separate the columns of each row. The character that is used to separate columns within a flat file is called the delimiter or separator. Though any character can be used as a delimiter, the most common delimiters are the tab, the comma, and a single space. Single-Space- Delimited Name Height Tab-Delimited Comma-Delimited Name Height Name, Height Omar 6.1 Omar 6.1 Omar, 6.1 Ali 5.9 Ali 5.9 Ali, 5.9 Abdullah 6.2 Abdullah 6.2 Abdullah, 6.2
DATA AND FORMAT Sometimes such files are referred to by their delimiter, such as a comma-separated values file or a tab-delimited file. When recording and working with geographic data, the same general format is applied. Rows are reserved for records, or in the case of geographic data, locations and columns or fields are used for the attributes or variables associated with each location. For example, the following tab-delimited flat file contains data for three places (i.e., countries) and three attributes or characteristics of each country (i.e., population, language, continent) as noted by the header. Country Population Language Continent France 65,000,000 French Europe Brazil 192,000,000 Portuguese South America Australia 22,000,000 English Australia
DATA AND FORMAT Files like those presented here are the building blocks of the various tables, charts, reports, graphs, and other visualizations that we see each and every day online, in print, and on television. They are also key components to the maps and geographic representations created by GISs. More often than not, and especially when working with GISs, you will work with multiple files. Such a grouping of multiple files is called a database. Since the files within a database may be different sizes, shapes, and even formats, we need to devise some type of system that will allow us to work, update, edit, integrate, share, and display the various data within the database. Such a system is generally referred to as a database management system (DBMS).
DATA ABOUT DATA Consider the following comma-delimited file: city, sun, temp, precip Los Angeles, 300, 70, 10 London, 50, 55, 40 Singapore, 330, 80, 60 Looking at the contents of the file, we can see that it contains data about the cities of Los Angeles, London, and Singapore. As noted, each field or attribute is separated by a comma, and the file also contains a header row that tells us about the data contained in each column. Or does it? What does the column sun refer to? Is it the number of sunny days this year, last year, annually, or when? What about temp ? Does this refer to the average daytime, evening, or annual temperature? For that matter, how is temperature measured? In Celsius? Fahrenheit? Kelvin? The column precip probably refers to precipitation, but again, what are the units or time frame for such measures and data? Finally, where did these data come from? Who collected them, when were they collected and for what purpose?
DATA ABOUT DATA The previous simple text file illustrates how we cannot and should not take data and information for granted. It also highlights two important concepts with regard to the source of data and to the contents of data files. With regard to data sources, data can be put into one of two distinct categories. The first category is called primary data. Primary data refer to data that are collected directly or on a firsthand basis. For example, if you wanted to examine the variability of local temperatures in the month of May, and you recorded the temperature at noon every day in May, you would be constructing a primary data set. Conversely, secondary data refer to data collected by someone else or some other party. For instance, when we work with census or economic data collected and distributed by the government, we are using secondary data.
DATA ABOUT DATA Several factors influence the decision behind the construction and use of primary data sets versus secondary data sets. Among the most important factors are the costs associated with data acquisition in terms of money, availability, and time. In fact, the data acquisition and integration phase of most geographic information system (GIS) projects is often the most time consuming. In other words, locating, obtaining, and putting together the data to be used for a GIS project, whether you collect the data yourself or use secondary data, may indeed take up most of your time. Of course, depending on the purpose, availability, and need, it may not be necessary to construct an entirely new data set (i.e., primary data set). In light of the vast amounts of data and information that are publicly available, for example, via the Internet, the cost and time savings of using secondary data often offset any benefits that are associated with primary data collection.
DATA ABOUT DATA Now that we have a basic understanding of the difference between primary and secondary data, as well as the rationale behind each, how do we go about finding the data and information that we need? As noted earlier, there is an incredibly vast and growing amount of data and information available to us. To overcome this data and information overload we need to turn to even more data. In particular, we are looking for a special kind of data called metadata. Simply defined, metadata are data about data. At one level, a header row in a simple text file like those discussed in the previous section is analogous to metadata. The header row provides data (e.g., names and labels) about the subsequent rows of data.
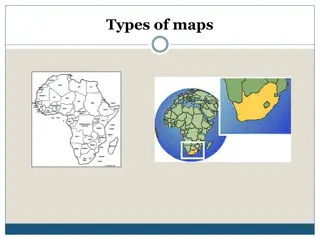
TYPES OF GIS DATA A geodatabase is a database that is in some way referenced to locations on the earth. Coupled with this data is usually data known as attribute data. Attribute data generally defined as additional information, which can then be tied to spatial data. GIS data can be separated into two categories: spatially referenced data which is represented by vector and raster forms (including imagery) and attribute tables which is represented in tabular format. Within the spatial referenced data group, the GIS data can be further classified into two different types: vector and raster. Most GIS software applications mainly focus on the usage and manipulation of vector geodatabases with added components to work with raster-based geodatabases.
VECTOR DATA Vectors models are points, lines and polygons. Vector data is not made up of a grid of pixels. Instead, vector graphics are comprised of vertices and paths. The three basic symbol types for vector data are points, lines and polygons (areas). Because cartographers use these symbols to represent real-world features in maps, they often have to decide based on the level of detail in the map.
VECTOR DATA (POINTS) POINTS are XY coordinates Vector points are simply XY coordinates. Generally, they are a latitude and longitude with a spatial reference frame. When features are too small to be represented as polygons, points are used. For example, you can t see city boundary lines at a global scale. In this case, maps often use points to display cities.
VECTOR DATA (LINES) LINES connect vertices Vector lines connect each vertex with paths. Basically, you re connecting the dots in a set order and it becomes a vector line with each dot representing a vertex. Lines usually represent features that are linear in nature. For example, maps show rivers, roads and pipelines as vector lines.
VECTOR DATA (POLYGONS) POLYGONS connect vertices and closes the path. When you join a set of vertices in a particular order and close it, this is now a vector polygon feature. In order to create a polygon, the first and last coordinate pair are the same. Cartographers use polygons to show boundaries and they all have an area.
RASTER DATA Raster data is made up of pixels (also referred to as grid cells). They are usually regularly-spaced and square but they don t have to be. Rasters often look pixelated because each pixel has its own value or class. For example: Each pixel value in a satellite image has a red, green and blue value. Alternatively, each value in an elevation map represents a specific height. It could represent anything from rainfall to land cover. Raster models are useful for storing data that varies continuously. For example, elevation surfaces, temperature and lead contamination.
TYPES OF RASTER DATA (DISCRETE RASTER) Raster data models consist of 2 categories discrete and continuous. DISCRETE RASTERS have distinct values. Discrete rasters have distinct themes or categories. For example, one grid cell represents a land cover class or a soil type. In a discrete raster land cover/use map, you can distinguish each thematic class. Each class can be discretely defined where it begins and ends. In other words, each land cover cell is definable and it fills the entire area of the cell. Discrete data usually consists of integers to represent classes. For example, the value 1 might represent urban areas, the value 2 represents forest and so on.
TYPES OF RASTER DATA (CONTINUOUS RASTER) CONTINUOUS RASTERS have gradual change Continuous rasters (non-discrete) are grid cells with gradual changing data such as elevation, temperature or an aerial photograph. A continuous raster surface can be derived from a fixed registration point. For example, digital elevation models use sea level as a registration point. Each cell represents a value above or below sea level. Phenomena can gradually vary along a continuous raster from a specific source.
VECTOR DATA ADVANTAGES AND DISADVANTAGES Because vector data have vertices and paths, this means that the graphical output is generally better. Furthermore, it gives higher geographic accuracy because data isn t dependent on grid size. Continuous data is poorly stored and displayed as vectors. In order to display continuous data as a vector, it would require generalization.
RASTER DATA ADVANTAGES Raster grid format is data model for satellite data and other remote sensing data. For raster positions, it s simple to understand cell size. Map algebra with raster data is usually quick and easy to perform. Overall, quantitative analysis is intuitive with discrete or continuous rasters.
RASTER DATA DISADVANTAGE Because cell size contributes to graphic quality, it can have a pixelated look and feel. To illustrate, linear features and paths are difficult to display. You cannot create network datasets or perform topology rules on raster's. Also, you don t have the flexibility with raster data attribute tables. Raster datasets can become potentially very large because they record values for each cell in an image. As resolution increases, the size of the cell decreases. But this comes at a cost for speed of processing and data storage.
VECTOR VS RASTER: SPATIAL DATA TYPES It s not always straight-forward which spatial data type you should use for your maps. In the end, it really comes down to the way in which the cartographer conceptualizes the feature in their map. Do you want to work with pixels or coordinates? Raster data works with pixels. Vector data consists of coordinates. What is your map scale? Vectors can scale objects up to the size of a billboard. But you don t get that type of flexibility with raster data Do you have restrictions for file size? Raster file size can result larger in comparison with vector data sets with the same phenomenon and area.


")
")
")