Applications of GIS in Urban Planning and Spatial Operations


GIS & REMOTE SENSING
Subject: GIS Studio
Topic: Applications of GIS in Urban Planning and spatial operations
Presented by: Pallavi Tiwari


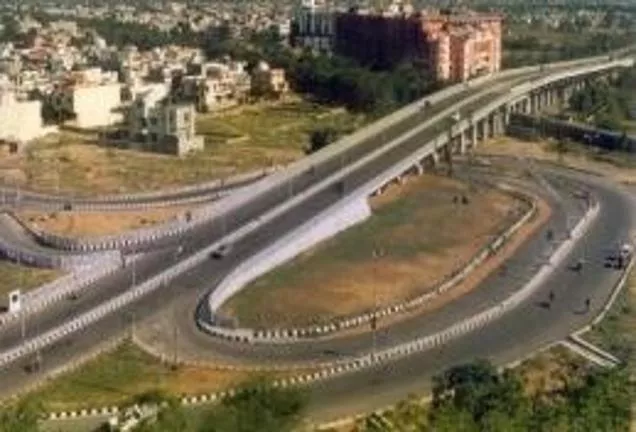
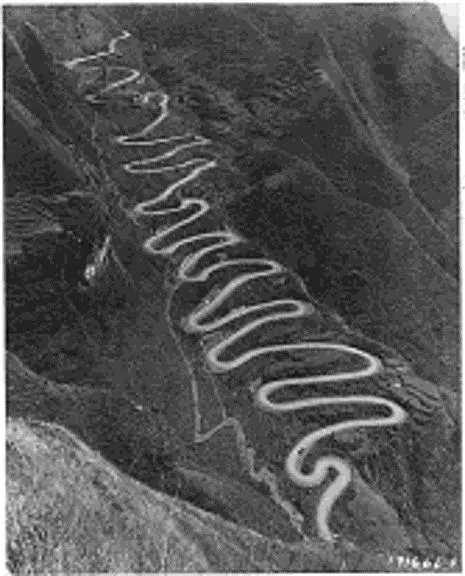
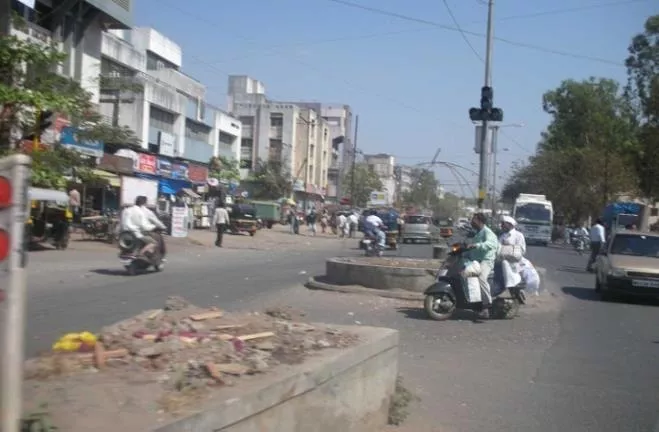
Route planning for road & rail
Road network updating
Logistics management
• Analysis of highway crash data
• Intelligent crash location
• Traffic planning tools
• Route selection and evaluation
Transportation
Utility Management
Creation of digital maps and asset maps of Electricity, Gas,
Telecom, Power, Water Utilities etc. linking them to the
relevant databases and developing systems for providing
decision support information.
What is a Geographic Information System?
•
Geographic Information System (GIS)
– A
computer-based
system for the collection, storage, organization, maintenance,
and analysis of spatially-referenced data, and the output of
spatially-referenced information.
•
Data
– Any collection of related facts; the basic elements of
information.
•
Information
- Data that have been processed to be useful; provides
answers to "who", "what", "where", and "when" questions
•
Information can only come from accurate data.
5
Applications of GIS
•
Urban Planning, Management & Policy
•
Zoning, subdivision planning
•
Land acquisition
•
Economic development
•
Code enforcement
•
Housing renovation programs
•
Emergency response
•
Crime analysis
•
Tax assessment
•
Environmental Sciences
•
Monitoring environmental risk
•
Modeling storm water runoff
•
Management of watersheds, floodplains,
wetlands, forests, aquifers
•
Environmental Impact Analysis
•
Hazardous or toxic facility siting
•
Groundwater modeling and contamination
tracking
•
Political Science
•
Redistricting
•
Analysis of election results
•
Predictive modeling
Civil Engineering/Utility
Locating underground facilities
Designing alignment for freeways, transit
Coordination of infrastructure maintenance
Business
Demographic Analysis
Market Penetration/ Share Analysis
Site Selection
Education Administration
Attendance Area Maintenance
Enrollment Projections
School Bus Routing
Real Estate
Neighborhood land prices
Traffic Impact Analysis
Determination of Highest and Best Use
Health Care
Epidemiology
Needs Analysis
Service Inventory
SPATIAL DATA
NON - SPATIAL DATA OR
ATTRIBUTES
How do we describe geographical features?
By recognizing two
types of data
:
•
Spatial data
which describes location (where)
•
Attribute data
which specifies characteristics at that location
(what, how much, and when)
How do we represent these digitally in a GIS?
By grouping into
layers
based on similar characteristics (e.g hydrography,
elevation, water lines, sewer lines, grocery sales) and using either:
•
vector
data model
•
raster
data
Raster vs. Vector Data Model
•
Vector data model and Raster data model can represent same phenomena
•
E.g. Elevation represented as surface (continuous field) using raster grid or as lines
representing contours of equal elevation (discrete objects), or as points of height (Z
values).
•
Data can be converted from one conceptual view to another
•
E.g. raster data layer can be derived from contour lines, point cloud
•
Selection of raster or vector model depends on the application or type of
operations to be performed
•
E.g. Elevation represented as surface (continuous field) in raster - to easily determine
slope, or
•
as discrete contours if printed maps of topography
Data Model Concepts
•
There are three basic types of vector objects: points, lines and polygons
•
Vector data model uses sets of coordinates and associated attribute data to define
discrete objects
•
Point
objects in spatial database represent location of entities considered to have no
dimension. Simplest type of spatial objects
•
E.g. wells, sampling points, poles, telephone towers, etc.
•
Line
objects are used to represent linear features using ordered set of coordinate pairs
•
E.g. infrastructure networks (transport networks: highways, railroads, etc.) ; utility networks: (gas, electric,
telephone, water, etc. ); airline networks: hubs and routes, etc.); natural networks such as river channels
•
Polygon
objects in spatial database represent entities
which covers an area
•
E.g. lakes, Buildings, parcels, etc.
•
Boundaries may be defined by natural phenomena (e.g.
lake), or by man made features (e.g census tracts,
neighborhoods)
•
E.g. Land cover data: forest, wetlands, urban areas, etc.
•
Soil data – soil types
•
Raster Data Model
defines the world as a regular set of cells in a uniform
grid pattern
•
Cells are square and evenly spaced in the x and y directions
•
Each cell represent attribute values and cell location of phenomena or
entities
•
Cell dimension specifies the length and width of the cell in surface units
•
Raster data models represent continuous phenomena or spatial features
•
E.g. Elevation/DEM, bathymetry, precipitation, slope, etc.
•
Raster data model may also be used to represent discrete data
•
E.g. Land cover: forest, wetlands, urban areas
•
Rasters are digital aerial photographs, imagery from satellites, digital
pictures, or even scanned maps
Attribute Tables
Non-spatial information associated
with a spatial feature is referred to as
an
attribute
. A feature on a GIS map is
linked to its record in the attribute
table by a unique numerical identifier
(ID). Every feature in a layer has an
identifier.
Attribute data can be broken down into four
measurement levels
:
•
Nominal
data which have no implied order, size or quantitative information (e.g. paved
and unpaved roads)
•
Ordinal
data have an implied order (e.g. ranked scores), however, we cannot quantify
the difference since a linear scale is not implied.
•
Interval
data are numeric and have a linear scale, however they do not have a true
zero and can therefore not be used to measure
relative
magnitudes. For example, one
cannot say that 60°F is twice as warm as 30°F since when presented in degrees °C the
temperature values are 15.5°C and -1.1°C respectively (and 15.5 is clearly not twice as
big as -1.1).
•
Ratio
scale data are interval data with a true zero such as monetary value (e.g. $1, $20,
$100).
•
Spatial operations use geometry functions to take spatial data
as input, analyze the data, then produce output data that is
the derivative of the analysis performed on the input data
•
E.g. Buffer, clip, intersection, union, dissolve, merge, etc.
Spatial Operations
Clip (Analysis)
•
Clip: Extracts input features that overlay the clip features
•
Creating a new feature class: Area of Interest (AOI), or study area
•
The Output Feature Class will contain all the attributes of the Input Features
Spatial Operations
Clip (Data Management )
•
Cuts out a portion of a raster dataset, mosaic dataset, or image
service layer.
•
Allows you to extract a portion of a raster dataset based on a
template extent
•
The clipped area is specified either by a rectangular envelope using
minimum and maximum x- and y-coordinates or by using an output
extent file
Spatial Operations
Intersect (Analysis)
•
Computes a geometric intersection of the input features.
•
Features or portions of features which overlap in all layers and/or feature classes
will be written to the output feature class.
•
Input Features must be simple features: point, multipoint, line, or polygon
Spatial Operations
Dissolve (Data Management)
•
Aggregates features based on specified attributes
Spatial Operations
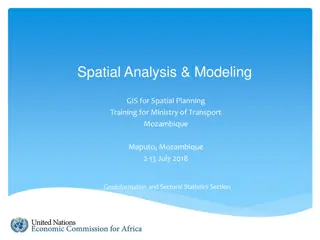
This presentation explores the wide range of applications of Geographic Information Systems (GIS) in urban planning, transportation management, utility management, environmental sciences, political science, civil engineering, business, education, real estate, healthcare, and more. GIS facilitates tasks such as transportation route planning, utility management, environmental risk monitoring, hazard analysis, election result analysis, infrastructure maintenance coordination, demographic analysis, site selection, and epidemiology needs assessment, among others. Its ability to collect, store, analyze, and output spatially-referenced data makes GIS a powerful tool for decision-making in various fields.

Download Presentation

Please find below an Image/Link to download the presentation.
The content on the website is provided AS IS for your information and personal use only. It may not be sold, licensed, or shared on other websites without obtaining consent from the author. Download presentation by click this link. If you encounter any issues during the download, it is possible that the publisher has removed the file from their server.
E N D
Presentation Transcript
GIS & REMOTE SENSING Subject: GIS Studio Topic: Applications of GIS in Urban Planning and spatial operations Presented by: Pallavi Tiwari
Transportation Route planning for road & rail Road network updating Logistics management Analysis of highway crash data Intelligent crash location Traffic planning tools Route selection and evaluation
Utility Management Creation of digital maps and asset maps of Electricity, Gas, Telecom, Power, Water Utilities etc. linking them to the relevant databases and developing systems for providing decision support information.
What is a Geographic Information System? Geographic Information System (GIS) A computer-based system for the collection, storage, organization, maintenance, and analysis of spatially-referenced data, and the output of spatially-referenced information. Data Any collection of related facts; the basic elements of information. Information - Data that have been processed to be useful; provides answers to "who", "what", "where", and "when" questions Information can only come from accurate data.
Applications of GIS Urban Planning, Management & Policy Zoning, subdivision planning Land acquisition Economic development Code enforcement Housing renovation programs Emergency response Crime analysis Tax assessment Environmental Sciences Monitoring environmental risk Modeling storm water runoff Management of watersheds, floodplains, wetlands, forests, aquifers Environmental Impact Analysis Hazardous or toxic facility siting Groundwater modeling and contamination tracking Political Science Redistricting Analysis of election results Predictive modeling Civil Engineering/Utility Locating underground facilities Designing alignment for freeways, transit Coordination of infrastructure maintenance Business Demographic Analysis Market Penetration/ Share Analysis Site Selection Education Administration Attendance Area Maintenance Enrollment Projections School Bus Routing Real Estate Neighborhood land prices Traffic Impact Analysis Determination of Highest and Best Use Health Care Epidemiology Needs Analysis Service Inventory 5
How do we describe geographical features? By recognizing two types of data: Spatial data which describes location (where) Attribute data which specifies characteristics at that location (what, how much, and when) NON - SPATIAL DATA OR ATTRIBUTES SPATIAL DATA
How do we represent these digitally in a GIS? By grouping into layers based on similar characteristics (e.g hydrography, elevation, water lines, sewer lines, grocery sales) and using either: vector data model raster data
Data Model Concepts Vector data model and Raster data model can represent same phenomena E.g. Elevation represented as surface (continuous field) using raster grid or as lines representing contours of equal elevation (discrete objects), or as points of height (Z values). Data can be converted from one conceptual view to another E.g. raster data layer can be derived from contour lines, point cloud Selection of raster or vector model depends on the application or type of operations to be performed E.g. Elevation represented as surface (continuous field) in raster - to easily determine slope, or as discrete contours if printed maps of topography
There are three basic types of vector objects: points, lines and polygons Vector data model uses sets of coordinates and associated attribute data to define discrete objects Point objects in spatial database represent location of entities considered to have no dimension. Simplest type of spatial objects E.g. wells, sampling points, poles, telephone towers, etc. Line objects are used to represent linear features using ordered set of coordinate pairs E.g. infrastructure networks (transport networks: highways, railroads, etc.) ; utility networks: (gas, electric, telephone, water, etc. ); airline networks: hubs and routes, etc.); natural networks such as river channels
Polygon objects in spatial database represent entities which covers an area E.g. lakes, Buildings, parcels, etc. Boundaries may be defined by natural phenomena (e.g. lake), or by man made features (e.g census tracts, neighborhoods) E.g. Land cover data: forest, wetlands, urban areas, etc. Soil data soil types
Raster Data Model defines the world as a regular set of cells in a uniform grid pattern Cells are square and evenly spaced in the x and y directions Each cell represent attribute values and cell location of phenomena or entities Cell dimension specifies the length and width of the cell in surface units Raster data models represent continuous phenomena or spatial features E.g. Elevation/DEM, bathymetry, precipitation, slope, etc. Raster data model may also be used to represent discrete data E.g. Land cover: forest, wetlands, urban areas Rasters are digital aerial photographs, imagery from satellites, digital pictures, or even scanned maps
Attribute Tables Non-spatial information associated with a spatial feature is referred to as an attribute. A feature on a GIS map is linked to its record in the attribute table by a unique numerical identifier (ID). Every feature in a layer has an identifier.
Attribute data can be broken down into four measurement levels: Nominal data which have no implied order, size or quantitative information (e.g. paved and unpaved roads) Ordinal data have an implied order (e.g. ranked scores), however, we cannot quantify the difference since a linear scale is not implied. Interval data are numeric and have a linear scale, however they do not have a true zero and can therefore not be used to measure relative magnitudes. For example, one cannot say that 60 F is twice as warm as 30 F since when presented in degrees C the temperature values are 15.5 C and -1.1 C respectively (and 15.5 is clearly not twice as big as -1.1). Ratio scale data are interval data with a true zero such as monetary value (e.g. $1, $20, $100).
Spatial Operations Spatial operations use geometry functions to take spatial data as input, analyze the data, then produce output data that is the derivative of the analysis performed on the input data E.g. Buffer, clip, intersection, union, dissolve, merge, etc.
Spatial Operations Clip (Analysis) Clip: Extracts input features that overlay the clip features Creating a new feature class: Area of Interest (AOI), or study area The Output Feature Class will contain all the attributes of the Input Features
Spatial Operations Clip (Data Management ) Cuts out a portion of a raster dataset, mosaic dataset, or image service layer. Allows you to extract a portion of a raster dataset based on a template extent The clipped area is specified either by a rectangular envelope using minimum and maximum x- and y-coordinates or by using an output extent file
Spatial Operations Intersect (Analysis) Computes a geometric intersection of the input features. Features or portions of features which overlap in all layers and/or feature classes will be written to the output feature class. Input Features must be simple features: point, multipoint, line, or polygon
Spatial Operations Dissolve (Data Management) Aggregates features based on specified attributes