GIS Data Models for Spatial Planning Training in Maputo, Mozambique

Explore the concepts of GIS data models including vector vs. raster, spatial relationships, spatial operations, and representation of real-world entities in a spatial database. Understand how spatial data models are used to manipulate spatially-referenced information and define the spatial location and extent of geographic objects. Learn about attribute data categorization and the organization of thematic layers in GIS databases.

Download Presentation

Please find below an Image/Link to download the presentation.
The content on the website is provided AS IS for your information and personal use only. It may not be sold, licensed, or shared on other websites without obtaining consent from the author. Download presentation by click this link. If you encounter any issues during the download, it is possible that the publisher has removed the file from their server.
E N D
Presentation Transcript
Geospatial Data models GIS for Spatial Planning Training for Ministry of Transport Mozambique Maputo, Mozambique 2-13 July 2018 Geoinformation and Sectoral Statistics Section
Content Data Model Concepts Types of Data Models: Vector Vs. Raster Scale and resolution Spatial relationships and spatial operations 2
Data Model Concepts Data represent a simplified view of the real world Physical entities or phenomena are approximated by data in GIS Spatial location, extent of the physical entities, non-spatial properties Entity is represented by spatial feature or spatial object Essential characteristics are also defined for each entity Objects are abstractions in a spatial database Spatial objects are the objects in a spatial database representing real-world entities with associated attributes
Data Model Concepts Spatial data model is means of representing and manipulating spatially- referenced information
Data Model Concepts Data model is the objects in a spatial database plus the relationships among them Coordinatesare used to define the spatial location and extent of geographic objects Attribute/non-spatialdata are linked with coordinate data to define each spatial object in the spatial database Most conceptualizations or models view the world as set of layers Each layer organizes the spatial and attribute data for a given set of cartographic/spatial objects E.g. Lake, river, road, etc. Thematic layers in GIS databases 5
Data Model Concepts Attribute data are categorized as nominal, ordinal, or interval/ratio Nominal attributes: variables that provide descriptive information about an object E.g. Color, vegetation type, city name, owner of parcel, soil type etc. Nominal attributes can also be images, film clips, audio, or other descriptive information E.g. Images of buildings or surroundings in real estate management database 7
Data Model Concepts Ordinal attributes: variables that imply rank order or scale by their values Ordinal attribute may be descriptive E.g. small, medium, large, Low, moderate, high, ranging from 1 to 5 (soil erosion level ), etc. Interval/ratio attributes are used for numeric items where both order and absolute difference in magnitudes are reflected in the number Real number on a linear scale E.g. area, length, weight, height, depth, value, etc. are represented by interval/ration variables 8
Data Model Concepts Spatial objects are represented in two most common spatial data models Spatial data models begin with conceptualization, how you will represent the real world phenomena or entities E.g. a road can be represented as lines; river as line or polygon; city and towns as point or polygon, etc. The road to include the road type (e.g.: highway, street, etc. or gravel, paved/ asphalted, etc.); width of road, 9
Data Model Concepts There are two main data models or conceptualizations used for spatial data: Vector data model and Raster data model Vector data model use discrete objects such as point, lines and polygons to represent the geometry of the real-world entities, discrete entities E.g. a road, river, city and towns, lakes or wetlands, farm land, etc. Raster data model represents continuous phenomena that may change continuously across a region E.g. Elevation, rainfall, temperature, soil moisture, etc. Raster model uses grid cells for representing continuous phenomena 10
Data Model Concepts Raster vs. Vector Data Model 12
Data Model Concepts Vector data model and Raster data model can represent same phenomena E.g. Elevation represented as surface (continuous field) using raster grid or as lines representing contours of equal elevation (discrete objects), or as points of height (Z values). Data can be converted from one conceptual view to another E.g. raster data layer can be derived from contour lines, point cloud Selection of raster or vector model depends on the application or type of operations to be performed E.g. Elevation represented as surface (continuous field) in raster - to easily determine slope, or as discrete contours if printed maps of topography 14
Vector Data Model There are three basic types of vector objects: points, lines and polygons Vector data model uses sets of coordinates and associated attribute data to define discrete objects Point objects in spatial database represent location of entities considered to have no dimension Simplest type of spatial objects E.g. wells, sampling points, poles, telephone towers, etc. Line objects are used to represent linear features using ordered set of coordinate pairs E.g. infrastructure networks (transport networks: highways, railroads, etc.) ; utility networks: (gas, electric, telephone, water, etc. ); airline networks: hubs and routes, etc.); natural networks such as river channels 15
Vector Data Model Polygon objects in spatial database represent entities which covers an area E.g. lakes, Buildings, parcels, etc. Boundaries may be defined by natural phenomena (e.g. lake), or by man made features (e.g census tracts, neighborhoods) E.g. Land cover data: forest, wetlands, urban areas, etc. Soil data soil types 16
Raster Data Model Raster Data Model defines the world as a regular set of cells in a uniform grid pattern Cells are square and evenly spaced in the x and y directions Each cell represent attribute values and cell location of phenomena or entities Cell dimension specifies the length and width of the cell in surface units Raster data models represent continuous phenomena or spatial features E.g. Elevation/DEM, bathymetry, precipitation, slope, etc. Raster data model may also be used to represent discrete data E.g. Land cover: forest, wetlands, urban areas Rasters are digital aerial photographs, imagery from satellites, digital pictures, or even scanned maps 17
TIN Data Model Triangulated Irregular Network (TIN) isdata model commonly used to represent terrain heights x, y, and z locations, used as measured points in TIN Result in TIN composed of nodes, lines and triangulated faces TIN used for digital elevation models (DEM) or digital terrain models (DTM) Very efficient way of representing topography 18
Scale and Resolution Scale is the relationship between distance on a map and the corresponding distance on the earth The ratio of distance on a map, to actual ground distance Expressed in a ratio: e.g. 1:100,000; 1:1,000 1:100,000 means one unit of distance on the map represents 100,000 of the same units of distance on the earth; i.e. 1 cm on the map equals 100,000 cm (1 km) on the ground Large scale maps show more detail; Small scale maps show less detail, but cover large parts of the earth Smaller denominator, larger scale or small map-to-ground ratio, small scale 20
Scale and Resolution GIS data is stored in a very different way than paper map data, map scale is different Paper maps have fixed map scale GIS maps don t have fixed map scale You can zoom in until the screen displays a square meter or less, or zoom out until the screen displays the entire earth This means that geographic data in a GIS doesn't really have a defined 'map scale' 21
Scale and Resolution Resolution is the size of the smallest feature that can be represented in a surface Ground resolution, spatial resolution Spatial resolution of an image is an indication of the size of a pixel in terms of ground dimensions. A spatial resolution of 30 meters means that one pixel represents an area 30 meters by 30 meters on the ground High resolution: features more closely resemble real-world features; small objects can be detected Low resolution: features simplified or not shown at all; only large features are visible 22
Spatial relationships Spatial relationships between features Do they overlap? Is one contained by the other? Does one cross the other? Geometries can be spatially related in different ways 23
Spatial Operations Spatial operations use geometry functions to take spatial data as input, analyze the data, then produce output data that is the derivative of the analysis performed on the input data E.g. Buffer, clip, intersection, union, dissolve, merge, etc. 24
Spatial Operations Buffer (Analysis) Creates buffer polygons around input features to a specified distance 25
Spatial Operations Clip (Analysis) Clip: Extracts input features that overlay the clip features Creating a new feature class: Area of Interest (AOI), or study area The Output Feature Class will contain all the attributes of the Input Features 26
Spatial Operations Clip (Data Management ) Cuts out a portion of a raster dataset, mosaic dataset, or image service layer. Allows you to extract a portion of a raster dataset based on a template extent The clipped area is specified either by a rectangular envelope using minimum and maximum x- and y-coordinates or by using an output extent file 27
Spatial Operations Intersect (Analysis) Computes a geometric intersection of the input features. Features or portions of features which overlap in all layers and/or feature classes will be written to the output feature class. Input Features must be simple features: point, multipoint, line, or polygon 28
Spatial Operations Dissolve (Data Management) Aggregates features based on specified attributes 29
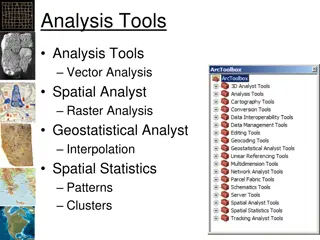
Spatial Operations Accessing the Tools (ArcToolbox) Open the Catalog Window > Expand Toolboxes > SystemToolboxes >Expand Analysis Tools or Data Management Tool Open ArcToolbox 30
THANK YOU! denekewa@Un.org