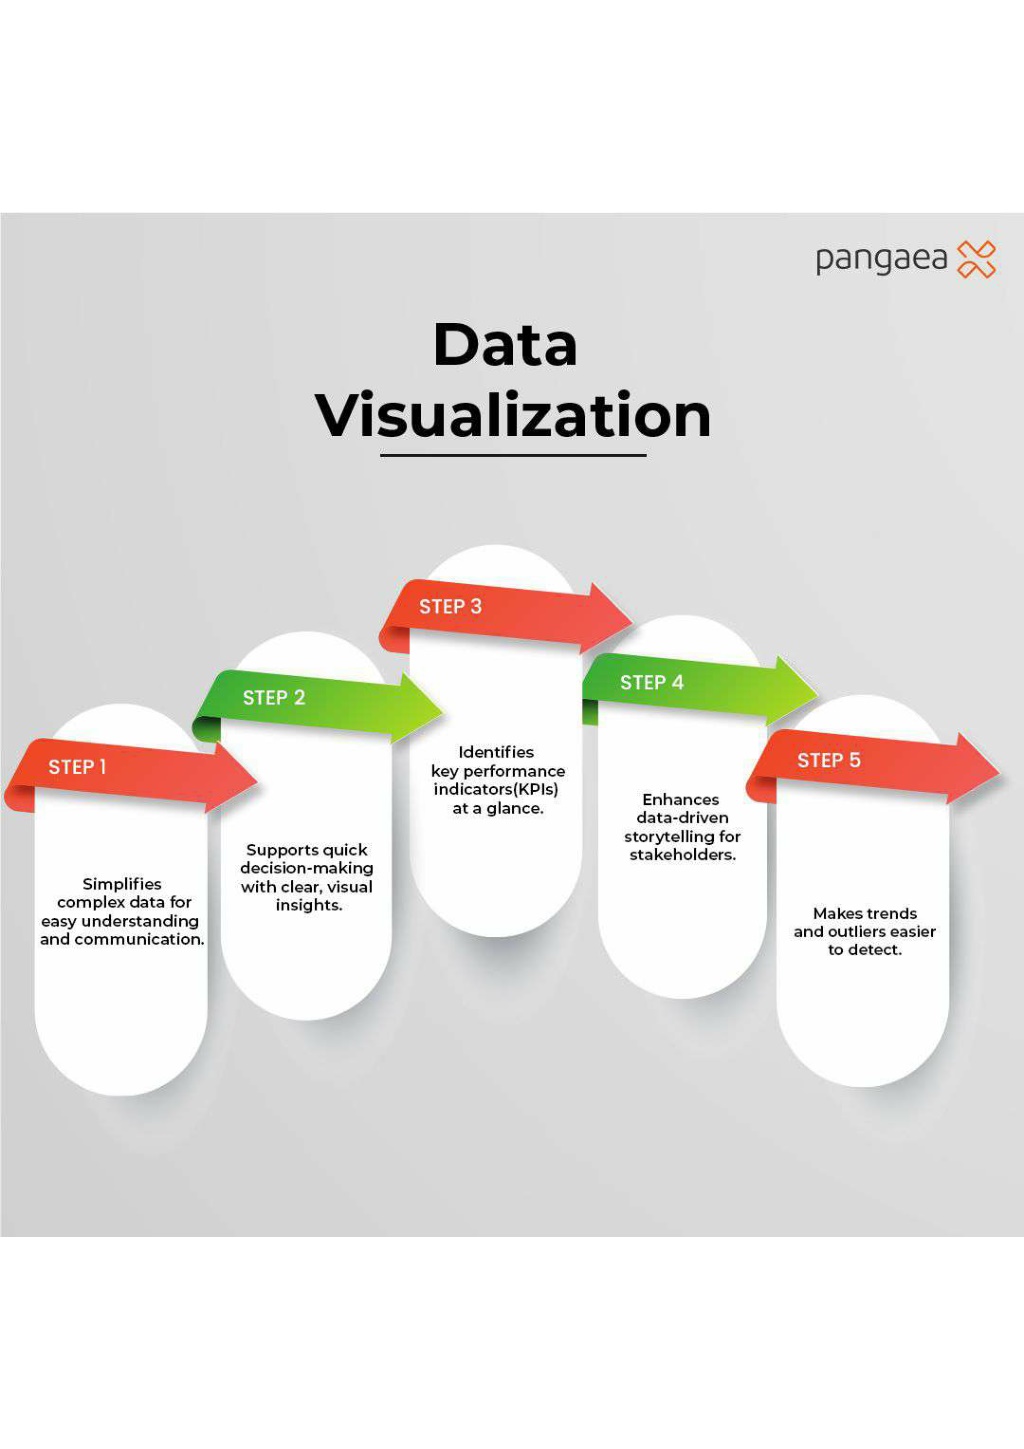
Maximize Business Impact with Data Visualization
This infographic shows how data visualization simplifies complex data, supports decision-making, highlights KPIs, and enhances data-driven storytelling. Its an essential tool for identifying trends and outliers. Discover expert data visualization talent at Pangaea X by visiting www.pangaeax.com.

Download Presentation

Please find below an Image/Link to download the presentation.
The content on the website is provided AS IS for your information and personal use only. It may not be sold, licensed, or shared on other websites without obtaining consent from the author. Download presentation by click this link. If you encounter any issues during the download, it is possible that the publisher has removed the file from their server.
E N D