Software Design Patterns for Information Visualization
Explore design patterns for information visualization interfaces, understand the complexities, and leverage tools like Google API. Learn about different software design patterns, categories of patterns for information visualization, and the relationships between them. Discover the reference model for structuring visualization applications, data organization techniques like data columns and cascaded tables, and utilizing relational graphs for efficient data representation.
- Software Design Patterns
- Information Visualization
- Google API
- Data Representation
- Interactive Controls

Download Presentation

Please find below an Image/Link to download the presentation.
The content on the website is provided AS IS for your information and personal use only. It may not be sold, licensed, or shared on other websites without obtaining consent from the author. Download presentation by click this link. If you encounter any issues during the download, it is possible that the publisher has removed the file from their server.
E N D
Presentation Transcript
Visualization Four groups Design pattern for information visualization Interface Design pattern and visual complexity Google API and Other related tools Pivot
Software Design Patterns for Information Visualization Mubarek K. Priyank H. Yu Chi Jen
Content Introduction Categories of SDP for IV Patterns Patterns working together
Introduction Diverse software architectures supporting information visualization However it is difficult to identify, evaluate and re-apply the design solutions Capture successful solutions in design patterns The pattern discussion follow software design pattern format
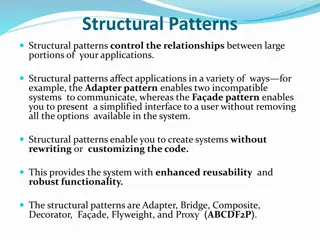
Categories The Information visualization patterns lie in one or more of the following groups Data representation Graphics Interaction
Reference Model Provides a general template for structuring visualization applications that separates data models, visual models, views and interactive controls. Right separation of concerns reflects the complexity, extensibility and reusability of software architectures. Provides a high-level template for application design whose implementation can be informed by other patterns.
Data Column Organize relational data into data columns providing flexible data representations and extensible data schemas.
Cascaded Table Allow relational data tables to inherit data from parent tables, efficiently supporting derived tables.
Relational Graph Use relational data tables to represent network structures, facilitating data reuse and efficient data processing. For optimized query processing, network structures are implemented using relational data tables to represent node and edge data. Each table stores various data attributes of nodes and edges in network.
Relational Graph Advantage: Helps unify data representation issues i.e. one can easily swap in and out edge data or node table can be reused across multiple graphs. Issue: Performance, in case of traversing graph with an unacceptable overhead.
Proxy Tuple Use an object relational mapping for accessing, manipulating, grouping and reordering table and graph data. Instead of accessing graph and table data directly, a proxy object is created to access them.
Expression Provides an expression language for data processing tasks such as specifying queries and computing derived values. Language statements are represented as tree of expression objects for data processing.
Scheduler Provide schedulable activities for implementing time-sensitive, potentially recurring operations. Includes animations and time-sensitive responses to user input.
Structure of Scheduler Pacer is used to adjust the scheduler : slow, fast
Operator Decompose visual data processing into a series of composable operators, enabling flexible and reconfigurable visual mappings. We will have granular control on the visualization and other operators can be applied easily
Renderer Separate visual components from their rendering methods, allowing dynamic determination of visual appearances Avoids creating sub-classing to change appearance Renderer de-couples the representation of a visual item from its rendering item s visual attributes into actual pixels Dedicated and re-usable module for renderer
Structure of renderer Application Java swing interface Prefuse visualization toolkit uses RendererFactory Related patterns Production Rule Flyweight
Production Rule Use a chain of if-then-else rules to dynamically determine visual properties using rule-based assignment or delegation. E.g. Default color encoding but overriding in special cases
Camera Provide a transformable camera view onto a visualization, supporting multiple views and spatial navigation of data displays. Panning and zooming arise in large data sets Multiple views - overview+detail Treat the data view as camera Moving, zooming, or rotating the camera accordingly changes the viewpoint
Structure of Camera pattern Known uses OpenGL - camera in 3D graphics Related Patterns Renderer Scheduler
Dynamic Query Binding Allow data selection and filtering criteria to be specified dynamically using direct manipulation interface components. Refining a data view through direct manipulation Sliders, range sliders, checkboxes and textboxes may be used for user input
Structure Known uses InfoVis Related Patterns Factory Method Expression
Conclusion Most of the patterns can be used in isolation Their relationship gives the greatest value E.g Scheduler and Operator => animation Relational graph and Proxy Tuple The patterns are not static and other related pattern may be created
References [1] J. Heer and M. Agrawala, Software Design Patterns for Information Visualization, IEEE Transactions on Visualization and Computer Graphics, Vol. 12 No. 5, Setp/Oct 2006 [2] Gamma and et al , Software Design Pattern