Data Visualization Presentations Collection

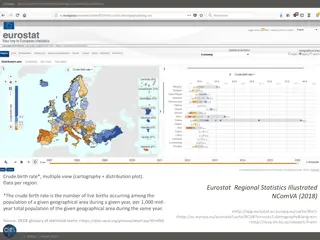
Collection of various image slides containing charts, graphs, and data visualization elements. The slides showcase different types of visual representations such as bar graphs, line charts, percentages, and more. Each slide provides a unique visualization, making it a diverse collection for presentation purposes.

Download Presentation

Please find below an Image/Link to download the presentation.
The content on the website is provided AS IS for your information and personal use only. It may not be sold, licensed, or shared on other websites without obtaining consent from the author. Download presentation by click this link. If you encounter any issues during the download, it is possible that the publisher has removed the file from their server.
E N D
Presentation Transcript
3 Name of chart can be placed here Category 4 Category 3 Category 2 Category 1 0 1 2 3 4 5 6 Series 3 Series 2 Series 1
4 Name of chart can be placed here Category 4 Category 3 Category 2 Category 1 0 1 2 3 4 5 6 Series 3 Series 2 Series 1
5 Name of chart can be placed here 9% 10% 58% 23% 1st Qtr 2nd Qtr 3rd Qtr 4th Qtr
6 12 343 567 3 287 498 34 353 456 578 678 23 424 , ? 345 353 28 764 67 868 909 837 459 900 077 67 868 1 293 090 23 324 213 12 334 34 567 63 836 746 35 216 735 75 984 375 3 984 759 835 34 785
7 34 353 456 578 678 23 424 , ? 67 868 909 837 459 900 077 23 324 213 12 334 34 567 75 984 375 3 984 759 835 34 785
9 Name of graph 60 50 40 30 20 10 0 Category 1 Category 2 Category 3 Category 4 Series 1 Series 2 Series 3 Series 12 Series 23 Series 34
10 Name of chart 9% 3% 29% 34% 2% 13% 1% 9% 1st Qtr 2nd Qtr 3rd Qtr 4th Qtr 1st Qtr 2nd Qtr 3rd Qtr 4th Qtr
11 Name of chart 1st Qtr 2nd Qtr 3rd Qtr 4th Qtr 1st Qtr 2nd Qtr 3rd Qtr 4th Qtr