Visualization of Crude Birth Rates in European Regions
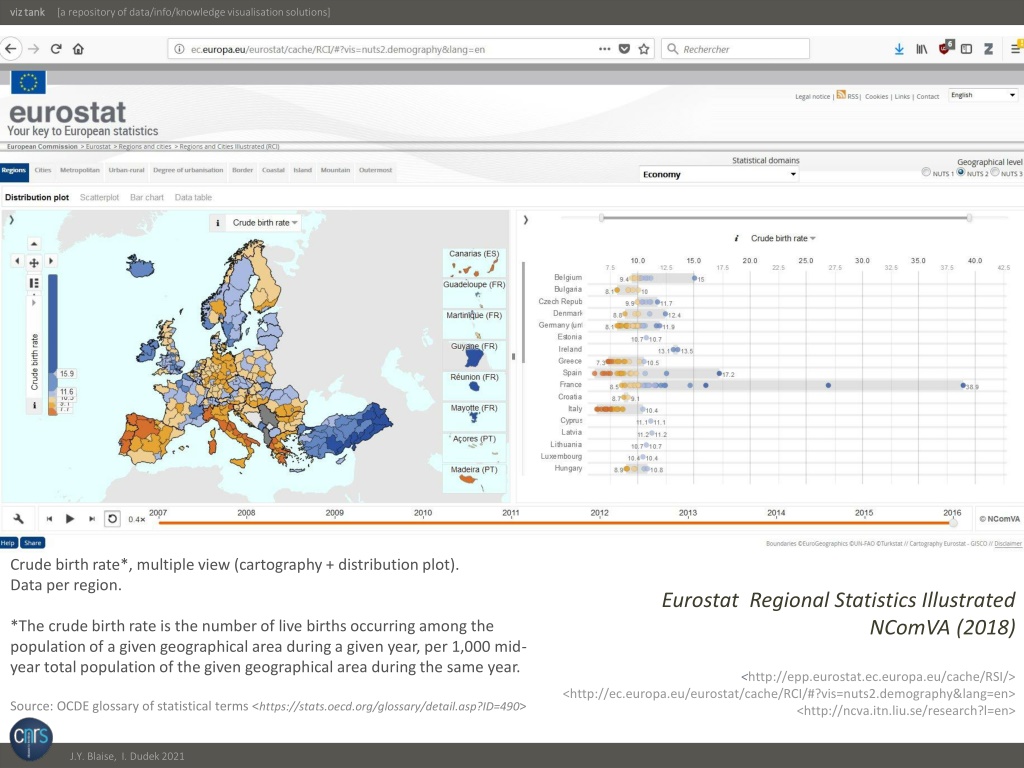
Explore the visualization of crude birth rates in different European regions using cartography and distribution plots. The data, sourced from Eurostat Regional Statistics, illustrates variations across regions, with France showing both the lowest and highest rates relative to other European countries. The visualizations provide insights into regional trends and disparities in birth rates.

Download Presentation

Please find below an Image/Link to download the presentation.
The content on the website is provided AS IS for your information and personal use only. It may not be sold, licensed, or shared on other websites without obtaining consent from the author. Download presentation by click this link. If you encounter any issues during the download, it is possible that the publisher has removed the file from their server.
E N D
Presentation Transcript
viz viz tank tank [a repository of data/info/knowledge visualisation solutions] Crude birth rate*, multiple view (cartography + distribution plot). Data per region. Eurostat Regional Statistics Illustrated NComVA (2018) *The crude birth rate is the number of live births occurring among the population of a given geographical area during a given year, per 1,000 mid- year total population of the given geographical area during the same year. <http://epp.eurostat.ec.europa.eu/cache/RSI/> <http://ec.europa.eu/eurostat/cache/RCI/#?vis=nuts2.demography&lang=en> Source: OCDE glossary of statistical terms <https://stats.oecd.org/glossary/detail.asp?ID=490> <http://ncva.itn.liu.se/research?l=en> J.Y. Blaise, I. Dudek 2021
viz viz tank tank [a repository of data/info/knowledge visualisation solutions] Statistiques par r gions > Observer la variabilit de leurs surfaces France, Espagne, valeurs divergentes mais m me tendance des constrastes entre regions (r partition tir e des points) Crude birth rate*, multiple view (cartography + distribution plot). Data per region. Eurostat Regional Statistics Illustrated NComVA (2018) *The crude birth rate is the number of live births occurring among the population of a given geographical area during a given year, per 1,000 mid- year total population of the given geographical area during the same year. <http://epp.eurostat.ec.europa.eu/cache/RSI/> <http://ec.europa.eu/eurostat/cache/RCI/#?vis=nuts2.demography&lang=en> Source: OCDE glossary of statistical terms <https://stats.oecd.org/glossary/detail.asp?ID=490> <http://ncva.itn.liu.se/research?l=en> J.Y. Blaise, I. Dudek 2021
viz viz tank tank [a repository of data/info/knowledge visualisation solutions] France, Identification / localisation du taux le plus faible Crude birth rate*, multiple view (cartography + distribution plot). Data per region. Eurostat Regional Statistics Illustrated NComVA (2018) *The crude birth rate is the number of live births occurring among the population of a given geographical area during a given year, per 1,000 mid- year total population of the given geographical area during the same year. <http://epp.eurostat.ec.europa.eu/cache/RSI/> <http://ec.europa.eu/eurostat/cache/RCI/#?vis=nuts2.demography&lang=en> Source: OCDE glossary of statistical terms <https://stats.oecd.org/glossary/detail.asp?ID=490> <http://ncva.itn.liu.se/research?l=en> J.Y. Blaise, I. Dudek 2021
viz viz tank tank [a repository of data/info/knowledge visualisation solutions] France, Des maxima tr s divergents du cluster national, et tr s sup rieurs au reste des pays europ ens. Crude birth rate*, multiple view (cartography + distribution plot). Data per region. Eurostat Regional Statistics Illustrated NComVA (2018) *The crude birth rate is the number of live births occurring among the population of a given geographical area during a given year, per 1,000 mid- year total population of the given geographical area during the same year. <http://epp.eurostat.ec.europa.eu/cache/RSI/> <http://ec.europa.eu/eurostat/cache/RCI/#?vis=nuts2.demography&lang=en> Source: OCDE glossary of statistical terms <https://stats.oecd.org/glossary/detail.asp?ID=490> <http://ncva.itn.liu.se/research?l=en> J.Y. Blaise, I. Dudek 2021