Bibitor LLC Inventory Analysis Case Study Phase 3


Bibitor LLC*
Inventory Analysis Case Study
Phase 3
*Note1: Bibitor, LLC is a fictitious company based on data created by the HUB of Analytics
Education @
www.hubae.org
.
Introduction and
Case Overview
Objectives
•
This case study is designed to enhance your understanding and knowledge of data
analytics, including leveraging analytics to make business decisions.
•
By completing this case, you will obtain the following:
-
An understanding of what data analytics and visualization are
-
The ability to utilize analytic tools
-
Comfort in leveraging data in making decisions
-
Skills to select data components for analysis and illustrate results to highlight data
tracking and identify conditions for exception analysis or business advisory strategy
Case Format
•
You should plan to work in teams of 4 to 5 students to complete the case. This will give
you the opportunity to share the learning, knowledge, and experience.
•
This case will be delivered in three phases. Each phase includes an instructional
component to learn how to manage the data within the tool and case study exercises
utilizing the skills.
-
Phase 1: Introduction to Data Preparation
◦
Load data exported from company into SQLite to put it into a format for analysis and
create tables which can be used by other analysis tools.
-
Phase 2: Introduction to Data Discovery and Visualization
◦
Using tables created in Phase 1, load data into Tableau to perform analysis then
create and interpret visualizations.
-
Phase 3: Introduction to Statistical Analysis
◦
Analyze one set of independent/dependent variables from each of the two case
studies and create a tableau worksheet that uses linear regression to provide some
insight into the data.
Case Materials
•
A
l
l
t
h
e
m
a
t
e
r
i
a
l
s
r
e
q
u
i
r
e
d
t
o
c
o
m
p
l
e
t
e
t
h
e
c
a
s
e
c
a
n
b
e
f
o
u
n
d
a
t
(
(
L
O
C
A
T
I
O
N
)
)
.
Case Background
•
Bibitor, LLC* is a liquor store chain in the fictional state of Lincoln. It is a major retailer with
approximately 80 locations and total sales in excess of $450 million.
•
Bibitor has asked the team to complete due diligence on their wine and spirits business
looking at data for their beginning and ending inventory, purchases and sales for a
12 month period.
*Bibitor, LLC is a fictitious company based on data created by the HUB of Analytics Education @ www.hubae.org. The HUB of
Analytics Education materials are owned by Northeastern University. PricewaterhouseCoopers LLP is not responsible for any
errors or omissions in, or for the results obtained from the use of, the HUB of Analytics Education. The HUB of Analytics
Education materials are provided "as is", with no guarantee of completeness, accuracy, timeliness or of the results obtained
from the use of this information, and without warranty of any kind. In no event will PricewaterhouseCoopers LLP, or its partners,
principals, employees, or agents, be liable to you or anyone else for any decision made or action taken in reliance on the
information in the HUB of Analytics Education materials or for any consequential, special or similar damages, even if advised of
the possibility of such damages.
Getting Started – Phase 3 Pre-work
•
R
e
v
i
e
w
b
a
c
k
g
r
o
u
n
d
i
n
f
o
r
m
a
t
i
o
n
o
n
L
i
n
e
a
r
R
e
g
r
e
s
s
i
o
n
:
-
https://www.hackerearth.com/practice/machine-learning/machine-learning-
algorithms/beginners-guide-regression-analysis-plot-interpretations/tutorial/
•
Review Basic Concepts
-
S
i
n
g
l
e
-
v
a
r
i
a
b
l
e
L
i
n
e
a
r
R
e
g
r
e
s
s
i
o
n
(
D
e
f
i
n
i
t
i
o
n
)
:
a
s
t
a
t
i
s
t
i
c
a
l
m
e
t
h
o
d
t
h
a
t
a
l
l
o
w
s
f
o
r
t
h
e
e
v
a
l
u
a
t
i
o
n
o
f
t
h
e
r
e
l
a
t
i
o
n
s
h
i
p
b
e
t
w
e
e
n
t
w
o
c
o
n
t
i
n
u
o
u
s
v
a
r
i
a
b
l
e
s
,
o
n
e
p
r
e
d
i
c
t
o
r
(
i
n
p
u
t
)
v
a
r
i
a
b
l
e
–
‘
x
’
,
a
n
d
o
n
e
r
e
s
p
o
n
s
e
(
o
u
t
p
u
t
)
v
a
r
i
a
b
l
e
—
‘
y
’
.
Phase 3 Pre-work
•
T
h
e
k
e
y
f
u
n
c
t
i
o
n
i
s
t
h
e
s
a
m
e
a
s
t
h
e
s
t
a
n
d
a
r
d
f
o
r
m
o
f
a
n
a
l
g
e
b
r
a
i
c
l
i
n
e
a
r
e
q
u
a
t
i
o
n
:
f(x) = b + a(x) = y
•
W
h
e
r
e
x
i
s
t
h
e
i
n
d
e
p
e
n
d
e
n
t
(
p
r
e
d
i
c
t
o
r
)
v
a
r
i
a
b
l
e
,
y
,
o
r
f
(
x
)
,
i
s
t
h
e
d
e
p
e
n
d
e
n
t
(
r
e
s
p
o
n
s
e
)
v
a
r
i
a
b
l
e
,
b
i
s
a
c
o
n
s
t
a
n
t
,
a
n
d
a
i
s
t
h
e
s
l
o
p
e
o
f
t
h
e
l
i
n
e
.
•
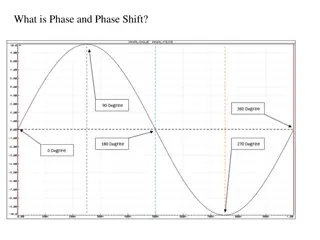
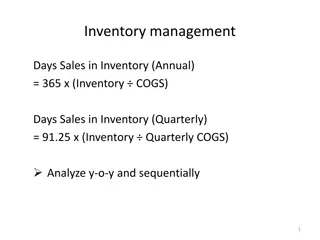
P
u
r
p
o
s
e
:
w
e
a
r
e
a
p
p
l
y
i
n
g
t
h
i
s
f
u
n
c
t
i
o
n
i
n
o
r
d
e
r
t
o
p
r
e
d
i
c
t
t
h
e
o
u
t
c
o
m
e
o
f
a
f
u
t
u
r
e
e
v
e
n
t
/
i
n
p
u
t
.
T
h
e
f
u
n
c
t
i
o
n
a
p
p
r
o
x
i
m
a
t
e
s
t
h
e
l
i
n
e
o
f
‘
b
e
s
t
f
i
t
’
g
i
v
e
n
t
h
e
r
e
l
a
t
i
o
n
s
h
i
p
o
f
t
w
o
v
a
r
i
a
b
l
e
s
b
a
s
e
d
u
p
o
n
p
r
e
-
e
x
i
s
t
i
n
g
/
h
i
s
t
o
r
i
c
a
l
d
a
t
a
.
A
s
s
u
c
h
,
i
n
r
e
f
e
r
e
n
c
e
t
o
t
h
e
f
o
l
l
o
w
i
n
g
e
x
a
m
p
l
e
g
r
a
p
h
,
w
e
w
o
u
l
d
e
x
p
e
c
t
t
h
a
t
n
e
w
e
v
e
n
t
s
w
i
t
h
i
n
p
u
t
v
a
l
u
e
=
4
,
w
o
u
l
d
r
e
s
u
l
t
i
n
a
n
o
u
t
p
u
t
v
a
l
u
e
o
f
~
1
2
.
5
.
Phase 3 Pre-work
Source:
https://www.google.com/search?q=basic+linear+equation+graph&rlz=1C1GGRV_enUS753US753&source=lnms&tbm=isch&s
a=X&ved=0ahUKEwjf29uDvJPVAhUKfiYKHQBvANIQ_AUICigB&biw=1533&bih=761#tbm=isch&q=basic+fitting+line+graph
&imgrc=PG9RR9w1ofQR6M
Phase 3 Pre-work
•
D
e
r
i
v
i
n
g
t
h
e
S
l
o
p
e
o
f
t
h
e
l
i
n
e
o
f
b
e
s
t
f
i
t
:
-
N
u
m
e
r
a
t
o
r
:
f
o
r
e
a
c
h
k
n
o
w
n
d
a
t
a
p
o
i
n
t
,
c
a
l
c
u
l
a
t
e
t
h
e
s
u
m
o
f
t
h
e
v
a
r
i
a
n
c
e
s
–
w
h
e
r
e
p
o
i
n
t
i
s
e
a
c
h
k
n
o
w
n
e
v
e
n
t
,
a
n
d
i
s
t
h
e
c
a
l
c
u
l
a
t
e
d
m
e
a
n
o
f
t
h
e
i
n
d
e
p
e
n
d
e
n
t
v
a
r
i
a
b
l
e
v
a
l
u
e
s
,
a
n
d
t
h
e
i
s
t
h
e
c
a
l
c
u
l
a
t
e
d
m
e
a
n
o
f
t
h
e
d
e
p
e
n
d
e
n
t
v
a
r
i
a
b
l
e
v
a
l
u
e
s
.
-
D
e
n
o
m
i
n
a
t
o
r
:
f
o
r
e
a
c
h
k
n
o
w
n
i
n
d
e
p
e
n
d
e
n
t
v
a
r
i
a
b
l
e
v
a
l
u
e
,
c
a
l
c
u
l
a
t
e
t
h
e
s
u
m
o
f
s
q
u
a
r
e
s
o
f
v
a
r
i
a
n
c
e
–
w
h
e
r
e
i
s
e
a
c
h
k
n
o
w
n
i
n
d
e
p
e
n
d
e
n
t
v
a
r
i
a
b
l
e
v
a
l
u
e
a
n
d
i
s
t
h
e
c
a
l
c
u
l
a
t
e
d
m
e
a
n
.
Note: If you want to learn how to process this work in
Tableau, refer to Tableau Help > Anayze box > Build-
It-Yourself Exercises > Build A Line Chart.
Phase 3 Pre-work
•
D
e
r
i
v
i
n
g
t
h
e
C
o
n
s
t
a
n
t
o
f
t
h
e
l
i
n
e
o
f
b
e
s
t
f
i
t
:
-
Where a is slope, is the calculated
mean of the dependent variable values,
and is the calculated mean of the
independent variable values.
Phase 3:
Introduction to
Statistical Analysis
Statistical Analysis
•
Now that you can extract and format data and utilize visualization tools, the steps in this
phase will demonstrate how to further use these tools to evaluate the relationships
between two continuous variables.
Review of Pre-Work and Case Results
Practice Ex. 1: Using SQL to calculate the Slope and the
Constant for the line of best fit.
•
In your class SQLite database, table ‘VendorInvoicesDec’, we would like to further
evaluate the relationship between quantity billed, and the related freight costs. We are
hypothesizing that the larger the quantity billed, the higher the freight costs. Using SQLite,
calculate the Slope and Constant for the ‘best fit’ line equation for these two variables.
Slope = 0.04858
Constant = 69.93
Note: You can also create a Trend Line in Tableau. For guidance: Tableau Help > Design Views and
Analyze Data > Work with Time > Trend Lines
Using Regression in Tableau
•
Note from Tableau Help:
-
"To add trend lines to a view, both
axes must contain a field that can be
interpreted as a number.
-
F
o
r
e
x
a
m
p
l
e
,
y
o
u
c
a
n
n
o
t
a
d
d
a
t
r
e
n
d
l
i
n
e
t
o
a
v
i
e
w
t
h
a
t
h
a
s
t
h
e
P
r
o
d
u
c
t
C
a
t
e
g
o
r
y
d
i
m
e
n
s
i
o
n
,
w
h
i
c
h
c
o
n
t
a
i
n
s
s
t
r
i
n
g
s
,
o
n
t
h
e
C
o
l
u
m
n
s
s
h
e
l
f
a
n
d
t
h
e
P
r
o
f
i
t
m
e
a
s
u
r
e
o
n
t
h
e
R
o
w
s
s
h
e
l
f
.
-
However, you can add a trend line to
a view of sales over time because
both sales and time can be interpreted
as numeric values."
Case Studies
Instructions
•
Analyze one set of independent/dependent variables from each of the two case studies
on the next 2 slides and create a tableau worksheet that uses linear regression to provide
some insight into the data.
•
When selecting your independent/dependent variables, determine your rationale to
support the notion that the independent variable precedes or affects the dependent
variable and not the other way around.
•
Document your explanation you observe in these data trends.
Case 1 (for reference from phase 2)
•
Executive leadership is looking for dashboard reporting that would be useful to help
identify and monitor vendor activity in order to focus efforts strategically on key
supplier relationships.
•
Create (1) an aggregate table that includes all critical vendor billings and their associated
purchasing activity
•
Create (2) separate tables to store key information, such as ‘top 10 vendors’ by quantity
purchased. Name all tables you create ‘c1_Prep_[table_name]’
Case 2 (for reference from phase 2)
•
You notice that there is inventory that is purchased but sits on the shelf for a long period
of time rather than being sold.
•
As such, there is an opportunity to add value to the procurement process by identifying
trends in the timing inventory purchased versus its corresponding sale.
•
Consider key data points around purchase prices, seasonality, and vendor information
in creating an aggregate table for future visual & statistical analysis.
•
N
a
m
e
t
h
e
t
a
b
l
e
y
o
u
c
r
e
a
t
e
‘
c
2
_
P
r
e
p
_
[
t
a
b
l
e
_
n
a
m
e
]
’
.
Thank You.
This case study by Bibitor LLC involves analyzing data related to the liquor store chain's wine and spirits business. Students will gain insight into data analytics, visualization, and statistical analysis to make informed business decisions. The case is presented in phases, focusing on data preparation, discovery, visualization, and statistical analysis using tools like SQLite and Tableau. Through teamwork, students will enhance their data analysis skills and learn how to leverage data for strategic decision-making.

Download Presentation

Please find below an Image/Link to download the presentation.
The content on the website is provided AS IS for your information and personal use only. It may not be sold, licensed, or shared on other websites without obtaining consent from the author. Download presentation by click this link. If you encounter any issues during the download, it is possible that the publisher has removed the file from their server.
E N D
Presentation Transcript
Bibitor LLC* Inventory Analysis Case Study Phase 3 *Note1: Bibitor, LLC is a fictitious company based on data created by the HUB of Analytics Education @ www.hubae.org.
Introduction and Case Overview 2 PwC
Objectives This case study is designed to enhance your understanding and knowledge of data analytics, including leveraging analytics to make business decisions. By completing this case, you will obtain the following: - An understanding of what data analytics and visualization are - The ability to utilize analytic tools - Comfort in leveraging data in making decisions - Skills to select data components for analysis and illustrate results to highlight data tracking and identify conditions for exception analysis or business advisory strategy 3 PwC
Case Format You should plan to work in teams of 4 to 5 students to complete the case. This will give you the opportunity to share the learning, knowledge, and experience. This case will be delivered in three phases. Each phase includes an instructional component to learn how to manage the data within the tool and case study exercises utilizing the skills. - Phase 1: Introduction to Data Preparation Load data exported from company into SQLite to put it into a format for analysis and create tables which can be used by other analysis tools. - Phase 2: Introduction to Data Discovery and Visualization Using tables created in Phase 1, load data into Tableau to perform analysis then create and interpret visualizations. - Phase 3: Introduction to Statistical Analysis Analyze one set of independent/dependent variables from each of the two case studies and create a tableau worksheet that uses linear regression to provide some insight into the data. 4 PwC
Case Materials All the materials required to complete the case can be found at ((LOCATION)). 5 PwC
Case Background Bibitor, LLC* is a liquor store chain in the fictional state of Lincoln. It is a major retailer with approximately 80 locations and total sales in excess of $450 million. Bibitor has asked the team to complete due diligence on their wine and spirits business looking at data for their beginning and ending inventory, purchases and sales for a 12 month period. *Bibitor, LLC is a fictitious company based on data created by the HUB of Analytics Education @ www.hubae.org. The HUB of Analytics Education materials are owned by Northeastern University. PricewaterhouseCoopers LLP is not responsible for any errors or omissions in, or for the results obtained from the use of, the HUB of Analytics Education. The HUB of Analytics Education materials are provided "as is", with no guarantee of completeness, accuracy, timeliness or of the results obtained from the use of this information, and without warranty of any kind. In no event will PricewaterhouseCoopers LLP, or its partners, principals, employees, or agents, be liable to you or anyone else for any decision made or action taken in reliance on the information in the HUB of Analytics Education materials or for any consequential, special or similar damages, even if advised of the possibility of such damages. 6 PwC
Getting Started Phase 3 Pre-work Review background information on Linear Regression: - https://www.hackerearth.com/practice/machine-learning/machine-learning- algorithms/beginners-guide-regression-analysis-plot-interpretations/tutorial/ Review Basic Concepts - Single-variable Linear Regression (Definition): a statistical method that allows for the evaluation of the relationship between two continuous variables, one predictor (input) variable x , and one response (output) variable y . 7 PwC
Phase 3 Pre-work The key function is the same as the standard form of an algebraic linear equation: f(x) = b + a(x) = y Where x is the independent (predictor) variable, y, or f(x), is the dependent (response) variable, b is a constant, and a is the slope of the line. Purpose: we are applying this function in order to predict the outcome of a future event/input. The function approximates the line of best fit given the relationship of two variables based upon pre-existing/historical data. As such, in reference to the following example graph, we would expect that new events with input value = 4, would result in an output value of ~12.5. 8 PwC
Phase 3 Pre-work Source: https://www.google.com/search?q=basic+linear+equation+graph&rlz=1C1GGRV_enUS753US753&source=lnms&tbm=isch&s a=X&ved=0ahUKEwjf29uDvJPVAhUKfiYKHQBvANIQ_AUICigB&biw=1533&bih=761#tbm=isch&q=basic+fitting+line+graph &imgrc=PG9RR9w1ofQR6M 9 PwC
Phase 3 Pre-work Deriving the Slope of the line of best fit: - Numerator: for each known data point, calculate the sum of the variances where point is each known event, and is the calculated mean of the independent variable values, and the is the calculated mean of the dependent variable values. - Denominator: for each known independent variable value, calculate the sum of squares of variance where is each known independent variable value and is the calculated mean. Note: If you want to learn how to process this work in Tableau, refer to Tableau Help > Anayze box > Build- It-Yourself Exercises > Build A Line Chart. 10 PwC
Phase 3 Pre-work Deriving the Constant of the line of best fit: - Where a is slope, is the calculated mean of the dependent variable values, and is the calculated mean of the independent variable values. 11 PwC
Phase 3: Introduction to Statistical Analysis 12 PwC
Statistical Analysis Now that you can extract and format data and utilize visualization tools, the steps in this phase will demonstrate how to further use these tools to evaluate the relationships between two continuous variables. 13 PwC
Practice Ex. 1: Using SQL to calculate the Slope and the Constant for the line of best fit. In your class SQLite database, table VendorInvoicesDec , we would like to further evaluate the relationship between quantity billed, and the related freight costs. We are hypothesizing that the larger the quantity billed, the higher the freight costs. Using SQLite, calculate the Slope and Constant for the best fit line equation for these two variables. Slope = 0.04858 Constant = 69.93 Note: You can also create a Trend Line in Tableau. For guidance: Tableau Help > Design Views and Analyze Data > Work with Time > Trend Lines 15 PwC
Using Regression in Tableau Note from Tableau Help: - "To add trend lines to a view, both axes must contain a field that can be interpreted as a number. - For example, you cannot add a trend line to a view that has the Product Category dimension, which contains strings, on the Columns shelf and the Profit measure on the Rows shelf. - However, you can add a trend line to a view of sales over time because both sales and time can be interpreted as numeric values." 16 PwC
Case Studies 17 PwC
Instructions Analyze one set of independent/dependent variables from each of the two case studies on the next 2 slides and create a tableau worksheet that uses linear regression to provide some insight into the data. When selecting your independent/dependent variables, determine your rationale to support the notion that the independent variable precedes or affects the dependent variable and not the other way around. Document your explanation you observe in these data trends. 18 PwC
Case 1 (for reference from phase 2) Executive leadership is looking for dashboard reporting that would be useful to help identify and monitor vendor activity in order to focus efforts strategically on key supplier relationships. Create (1) an aggregate table that includes all critical vendor billings and their associated purchasing activity Create (2) separate tables to store key information, such as top 10 vendors by quantity purchased. Name all tables you create c1_Prep_[table_name] 19 PwC
Case 2 (for reference from phase 2) You notice that there is inventory that is purchased but sits on the shelf for a long period of time rather than being sold. As such, there is an opportunity to add value to the procurement process by identifying trends in the timing inventory purchased versus its corresponding sale. Consider key data points around purchase prices, seasonality, and vendor information in creating an aggregate table for future visual & statistical analysis. Name the table you create c2_Prep_[table_name] . 20 PwC


")
")