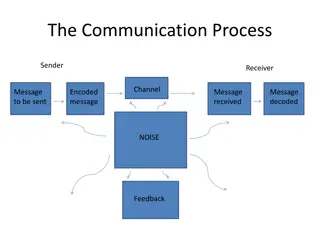
Effective Communication and Visualization Techniques for Analyzing Textual Data
Enhance your data analysis skills with effective communication, visualization, presentation, and storytelling techniques. Discover how to analyze textual data through word/phrase frequencies, collocations, and clustering. Explore tools for text processing and natural language processing, such as Excel, SPSS Modeler, Python, and more, to extract valuable insights. Dive into the world of data analytics with practical examples and case studies from the Department of Business Information & Analytics at the University of Denver.
- Data analysis
- Visualization techniques
- Textual data
- Communication skills
- Natural language processing

Download Presentation

Please find below an Image/Link to download the presentation.
The content on the website is provided AS IS for your information and personal use only. It may not be sold, licensed, or shared on other websites without obtaining consent from the author. Download presentation by click this link. If you encounter any issues during the download, it is possible that the publisher has removed the file from their server.
E N D
Presentation Transcript
MSMESB: Explain What It Means: Communication, Visualization, Presentation and Storytelling for Analysis Results Visualization of Textual Data Storytelling Kellie Keeling University of Denver Department of Business Information & Analytics
Department of Business Information & Analytics Department of Business Information & Analytics
Department of Business Information & Analytics Department of Business Information & Analytics
Department of Business Information & Analytics Department of Business Information & Analytics
Visualizations for these Analyses Word/Phrase Frequencies Collocations (Phrases) Clustering Department of Business Information & Analytics Department of Business Information & Analytics
Natural Language Processing Department of Business Information & Analytics Department of Business Information & Analytics
Software that helps Process Text Excel (manual process) Commercial Products (student options) SPSS Modeler Text Analytics SAS Enterprise Miner Alteryx (GUI for R) Open Source Coding Languages Python R Weka (GUI/Coding) Department of Business Information & Analytics Department of Business Information & Analytics
Natural Language Processing Department of Business Information & Analytics Department of Business Information & Analytics
Word Frequencies Tableau R SPSS Modeler Department of Business Information & Analytics Department of Business Information & Analytics
Tweets Excel PowerPivot I(http://tinyurl.com/AnalyticsforTwitter) Department of Business Information & Analytics Department of Business Information & Analytics
Word Cloud R Department of Business Information & Analytics Department of Business Information & Analytics
Filter (Freq > 8) Tableau R Department of Business Information & Analytics Department of Business Information & Analytics
Heat Map Tableau Department of Business Information & Analytics Department of Business Information & Analytics
Heat Map (Filter Freq > 8) Tableau Department of Business Information & Analytics Department of Business Information & Analytics
Parts of Speech Excel Pivot Tables/Pie NN: Noun, singular, NNP: Proper Noun, NNS: Noun, plural, JJ: Adjective, RB: Adverb
Collocations: Bigrams 2008 Bigrams occur more than twice Excel Node XL
Term by Document Matrix Documents Department of Business Information & Analytics Department of Business Information & Analytics
Clustering (k Means) R
Clustering (SPSS Modeler) (Shows 1 cluster and dotted lines to external dvi port)
Clustering (Hierarchical) R
Conclusions Textual Data contains a large amount of information. As you do your analysis, think of ways to use graphs/visualizations to help your reader easily absorb your textual data. Consider filtering for higher frequencies Make sure to 'clean' the data (remove stopwords) to focus on the important words/terms and combine similar terms: Statistic & Statistics Thank You! Kellie.Keeling@du.edu Department of Business Information & Analytics Department of Business Information & Analytics


")

")


")