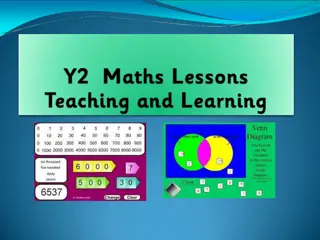
- Exploring Data Visualization Techniques for Year 7 Mathematics Curriculum
- This content provides insights into various data visualization techniques suitable for Year 7 students studying mathematics. It covers topics such as pie charts, frequency diagrams, averages, stem and leaf diagrams, and more. The explanations include examples of when to use pie charts appropriately and when they might not be the best option for displaying data. Additionally, it offers a recommended lesson structure for teachers to incorporate these concepts effectively into their curriculum.

Uploaded on Oct 07, 2024 | 0 Views
Download Presentation

Please find below an Image/Link to download the presentation.
The content on the website is provided AS IS for your information and personal use only. It may not be sold, licensed, or shared on other websites without obtaining consent from the author. Download presentation by click this link. If you encounter any issues during the download, it is possible that the publisher has removed the file from their server.
E N D
Presentation Transcript
Year 7: Charts & Averages Dr J Frost (jfrost@tiffin.kingston.sch.uk) Last modified: 18th March 2016
For Teacher Use: Recommended lesson structure: Go > Go > Lesson 1: Introduction. Pie charts. Lesson 2: Frequency Diagrams (Bar Charts vs Histograms, Frequency Polygons) Lesson 3: Averages (from listed data) and range. Lesson 4: Stem and Leaf Lesson 5: Mean of frequency table/Estimated mean of grouped data. Combined means. Go > Go > Go > Go > Go > Go > Go > Go >
Ways of Displaying Data In pairs, try and think of all the different types of charts and diagrams you could use to display data. Frequency Diagrams Pie charts (Covered in KS2, Year 7) Frequency Polygons (Covered in Year 7, 8) Bar charts (Covered in KS2) Histogram (Covered at GCSE) Stem & Leaf Diagrams (Covered in Year 7, 8) Pictogram (Covered in KS2) Box Plot (Covered in Year 8) Cumulative Frequency Graphs (Covered in Year 8)
Year 7 Pie Charts Dr J Frost (jfrost@tiffin.kingston.sch.uk)
Pie Charts For which sets of data is a pie chart suitable, and which are not (and why?) If not, suggest a better way to display this data. Pie charts should be used when we interested in proportions/percentage/fractions of some total and are less concerned with the frequencies. The fraction of the total goals of the four teams is not particularly significant here, it s the number of goals (i.e. the frequencies) we re more interested in. Goals so far this season by top 4 teams A more suitable representation would be a bar chart: Goals so far this season by top 4 teams ? 50 45 40 35 30 25 20 15 Chelsea Arsenal 10 QPR The Bickerstaffs 5 0 Chelsea Arsenal QPR The Bickerstaffs
Pie Charts For which sets of data is a pie chart suitable, and which are not (and why?) If not, suggest a better way to display this data. Hours Dr Frost spends doing this activity on a typical day Year 7's Favourite Colour 10% 17% 25% 42% 6% Sleep Travel Eat PS4 Work Giving Detentions Red Blue Green Taupe Other Yes this is suitable. We re interested in what proportion of a day Dr Frost is doing different things. ? Yes this is suitable. We re interested in what proportion of Year 7 who like each of the colours. The percentages here are more important than the frequencies. ? Bro Tip: Don t use a pie if either: (a) There s not a clear total for which we can have fractions of. (b) The pie chart wouldn t work if we were to omit the frequencies.
Frequencies Angles To work out frequencies from the angles, simply see what fraction of a full circle the slice occupies. Favourite Colour Favourite Colour Frequency Fraction 1 10 3 10 6 10 ? Angle 36 Red 20 ? ? 108 Green 60 ? ? 216 Blue 120 ? Red Green Blue 36 is 1 the 200 people like red 10 of 360 . So if a 1 10 of TOTAL 200 Best Event Frequency Fraction 1 3 17 120 63 120 ? Angle 120 ? Heptathlon 40 ? 51 ? Pentathlon 17 ? 189 ? Icosathlon 63 It s exactly the same principle the other way round. TOTAL 120
Frequencies Angles Favourite Colour Frequency Angle 75 is half extra of 50, so half extra of 32 is 32 + 16 = 48 32 ? Red 50 48 Green 75 TOTAL ? Even if the total isn t available, we can find missing angles/frequencies by: a) Finding out what one person/degree is worth or b) Scaling. e.g. If the angle doubles, the frequency doubles, and so on.
Test Your Understanding Instrument Frequency Fraction 6 40 11 40 23 40 ? Angle 54 Violin 18 ? ? 99 Piano 33 ? ? 207 Trumpet 69 ? TOTAL 120
How to draw a super awesome pie chart ? Title ? Key Circle drawn with compass and lines drawn with ruler.
Variants of pie charts Sectors labelled with percentages.
Variants of pie charts Sectors labelled with percentages and values. No key.
Calculating percentages and angles Squirrel Type Frequency Percentage Angle ? ? ? ? ? ? ? ? ? Red 49 30% 108 Grey 87 53% 191 Black 23 14% 50 Ferret (not a squirrel) 4 3% 11 ? 360 ? TOTAL 163 100%
Exercise 1 (on provided sheet) 2 We ll do the first one together... 1 Frequency 18 Favourite Colour Red Fraction 18 ? ? ? ? Angle 68 ? ? ? ? Games Console Owned Wii U Frequency 24 Fraction 24 ? ? ? ? Angle 34 ? ? ? ? 96 27 251 97 27 101 Blue 97 139 PS3 96 42 251 76 42 158 Green 76 109 Xbox 360 96 9 251 54 9 34 Orange 54 77 None 96 251 Games Console Owned Favourite Colour ? ? (Pie chart using protractor and ruler) (Pie chart using protractor and ruler) Wii U PS3 Xbox 360 None Red Blue Green Orange
Exercise 1 (on provided sheet) 4 3 Age of mother 16-30 Frequency Fraction Angle Holiday Destination Europe Frequency Fraction Angle 16 ? ? ? ? 41 ? ? ? ? 16 11 ? ? ? ? ? 11 92 140 27 43 25 27 69 30-35 209 ? ? ? 25 Asia 140 58 43 6 58 149 35-40 6 50 Africa 140 39 43 1 39 100 40+ 1 8 Antarctica 140 43 Age of mother Student continent of Origin ? ? (Pie chart using protractor and ruler) (Pie chart using protractor and ruler) Europe Asia Africa Antarctica 16-30 30-35 35-40 40+
Year 7 Frequency Diagrams Dr J Frost (jfrost@tiffin.kingston.sch.uk)
Frequency Diagrams When we record data, we may record the number of times we saw a value (we d use a tally when collecting the data) this is known as the frequency. A frequency table might show ungrouped or grouped data: Grouped Data Ungrouped Data Time ? (seconds) Shoe Size Frequency Frequency 10 ? < 15 12 4 9 15 ? < 20 13 10 1402 20 ? < 25 13 6 1 A Frequency Diagram are charts where the vertical axis shows the frequency. frequency
Types of Frequency Diagrams BAR CHART HISTOGRAM 25 Frequency (Density) 20 Frequency 15 10 5 0 0 1 2 3 4 Num People Driving Car Features: For discrete data. Values written on horizontal axis. Gaps between bars (why? to emphasise values are discrete) Can have multiple sets of data. Bro Note: Not all bar charts are frequency diagrams, e.g. if the vertical axis was sales ( ) ? 0 10 20 30 40 50 Height (m) Features: For grouped continuous data. No gaps between bars (because data is continuous) Allows bars to be different widths. ?
Frequency Polygons But suppose that we had data grouped into ranges. What would be a sensible value to represent each range? Sometimes we see frequency polygons combined with a histogram (why is not called a bar chart?). The points of the frequency polygon will be in the middle of the bars. IQ (x) Frequency 90 ? < 100 2 16 100 ? < 110 15 Join the points up with straight lines. 14 110 ? < 120 8 Frequency 12 120 ? < 130 0 130 ? < 140 4 10 8 We use the midpoint of each range. 6 4 This is known as a frequency polygon. 2 90 100 110 120 130 140 IQ
Exercise 2 (on provided sheet) Q1 Q2 ? ?
Exercise 2 (on provided sheet) Pick the most suitable chart to display the data described. (Put as appropriate) Q3 Data Pie Chart? Bar chart? Histogram/ Frequency Polygon? I m taking a survey to establish people s favourite brand of bread. I give a number of shoppers a taste of each and then record their favourite. I record the weights of dogs in Battersea Dogs Home and then group these into intervals of 5kg (e.g. 0 ? < 5). I want to show votes for 5 different candidates for 7AJW Form Captain. The frequencies depend on how many people are surveyed so are not important. We care more what proportion of people like each brand. ? Weight is continuous. ? We care about the number of votes for each. But a pie chart would also be suitable. ? I record the shoe size of 100 children. I group them into intervals, e.g. 1 -3, 3 - 5, 5 -7, I survey 500 university students who have just graduated to see what type of career they ve gone into (Education, Finance, ) I record the heights of 1000 trees and group them into intervals of 10m (0 ? < 10,10 ? < 20, ) Shoe size is discrete. Bar charts are better for grouped numerical data. ? ? Length is continuous. ?
Exercise 2 (on provided sheet) a) Draw a bar chart for this frequency table using the axis provided. Ensure you label your axes. Q4 Age 11-15 16-20 21-25 26-30 Freq 3 6 2 7 8 6 ? 4 b) Why technically are we using a bar chart and not a histogram? 2 While time is continuous, the age ranges are written here in a way that suggests that age is discrete (i.e. it s rounded to a whole). If we did allow decimal ages, what group would 15.6 go in? There would be gaps! 11-15 16-20 21-25 26-30 ?
Year 7 Averages and Range Dr J Frost (jfrost@tiffin.kingston.sch.uk)
Averages There are different averages: some are more meaningful than others depending on the context. What is the average number of ears in the world human population? ? The mode represents the most common value. Modal number of ears: 2 ? The mode (the modal average ) ? The median represents the middle value. Median number of ears: 2 ? The median The mean takes into account all values. We add up the values and divide by the number of values. Mean number of ears: 0.99999 The mean ?
Averages The mode tends to be a good average when the values are discrete and have a limited range of values. e.g. red red red green blue (the mode is red ) The mode (the modal average ) Median is often good because it makes it easier to tell whether a value is in the top 50% or the bottom 50%. It s also less sensitive to extreme values. The median The mean is the best average to use if we want to take all the values into account. The mean Salaries of people in the room: 13,000 18,000 24,000 25,500 26,000 32,000 45,000 1,200,000 What would the best average be here? Median, because the 1,200,000 salary drags up the mean. Otherwise all but one person would earn less than the average! ?
Averages Copy these numbers down, and work out the mean, mode and median. 10, 13, 15, 16, 17, 17, 20 The mode (the modal average ) 17? 16 ? The median 10 + 13 + 15 + 16 + 17 + 17 + 20 7 The mean ? = 15.43
Averages Round 2! Copy these numbers down, and work out the mean, mode and median. 13, 13, 17, 20 The mode (the modal average ) 13 ? When there s two items in the middle, we use the value in between: i.e. add them and divide by 2. 15 ? The median 15.75 ? The mean The range is the difference between the smallest and largest number. The range is NOT an average. 7 ? The range
Puzzles involving mean In pairs, see how many of these puzzles you can work out If the range of two numbers is 6 and the their mean is 15, what are the two numbers? The mean average of Dr Frost and Sebastian s age is 19.5. If Sebastian is 13, how old is Dr Frost? 3 1 ? Answer: 12 and 18 Answer: 26? The mean of the four numbers is 8. What is the missing number? The mode of four numbers is 5. The median is 6.5 and the mean is 7. What is the range? 2 4 3 4 5 ? Answer: 5 (The numbers are 5, 5, 8, 10) ? Answer: 20 ?
Using totals When dealing with problems involving mean, it s helpful to think about how the total changes: ????? = ??????? ??? ????? A class with 30 students gets an average mark of 60%. An extra student joins and the average mark rose to 61%. What mark did he get? What was the total mark before? ?? ?? = ???? ? What was the total mark after? ?? ?? = ???? ? Therefore what mark did the student get? ???? ???? = ??% ?
Test Your Understanding [JMC 2003 Q9] The mean age of the four members of All Sinners boy band is 19. What is the mean age when an extra member who is 24 years old joins them? A 19 B 20 C 21 D 22 E 24 A B C D E [JMC 2010 Q20] Nicky has to choose 7 different positive whole numbers whose mean is 7. What is the largest possible such number she could choose? A 7 B 28 C 34 D 43 E 49 A B C D E ????? = ? ? = ?? To make last number as large as possible, make others as small as possible. Smallest the others numbers could be: 1, 2, 3, 4, 5, 6 (which sum to 21) ?? ?? = ??
Exercise 3 (on provided sheet) [JMC 2011 Q13] What is the mean of 2 3 and 4 9? For the following lists of numbers, determine the following: 5 1 ? Solution: ? ? [JMC 2003 Q19] When the diagram below is complete, the number in the middle of each group of 3 adjoining cells is the mean of its two neighbours. What number goes in the right-hand end cell? 6 Mode None 3 6 None Median Mean 3 4.5 2 0.5 ? ? Range 4 12 10 1 ??? 1, 2, 3, 4, 5 1, 3, 3, 6, 10, 13 -4, -2, 6, 6 0, 1 3,1 -1.8, 0, 2.7, 4.9, 4.9, 14.9 3 6 1.5 0.5 Solution: 24 ? 3,2 4.9 3.8 5.12 16.7 [Kangaroo Grey 2013 Q4] There are five families living in my road. Which of the following could not be the mean number of children per family that live there? A 0.2 B 1.2 D 2.4 E 2.5 Solution: E [IMC 2004 Q10] What is the mean of 1 and 1 [JMC 2007 Q20] At halftime, Boarwarts Academy had scored all of the points so far in their annual match against Range Hill School. In the second half, each side scored three points. At the end of the match, Boardwarts Academy had scored 90% of the points. What fraction of the points in the match was scored in the second half? Solution: ? 7 Determine the numbers given the clues. a. Two numbers have a mean of 9 and a range of 6. Solution: 6, 12 b. The mode of four numbers is 6, the median is 8, and the mean is 9. Solution: 6, 6, 10, 14 c. The median of four numbers is 6, the range is 5 and the mode is 4. Solution: 4, 4, 8, 9 2 ? ? ? C 2.2 ? 2,1 3,1 4 8 6 ? Solution: ? ? ?? 9 [JMC 2013 Q2] Heidi is 2.1m tall, while Lola is only 1.4m tall. What is their average height? Solution: 1.75m [JMC 2007 Q12] The six-member squad for the Ladybirds five-a-side team consists of a 2-spot ladybird, a 10-spot, a 14-spot, an 18-spot, a 24-spot and a pine ladybird (on the bench). The average number of spots for members of the squad is 12. How many spots has the pine ladybird? S: 4 3 ? 4 ? ? ?
Exercise 3 (on provided sheet) [Kangaroo Grey 2011 Q12] A teacher has a list of marks: 17, 13, 5, 10, 14, 9, 12, 16. Which two marks can be removed without changing the mean? A 12 and 17 B 5 and 17 C 9 and 16 D 10 and 12 E 10 and 14 Solution: E 1 [JMO Mentoring Feb2012 Q5] On the second to last test of the school year, Barbara scored 98 and her average score so far then increased by 1. On the last test she scored 70 at which her average score then decreased by 2. How many tests has she taken through the school year? 10 ? The sum of five consecutive integers is equal to 140. What is the smallest of the five integers? 11 Solution: 26 ? Solution: 10 ? [IMC 2015 Q11] Three different positive integers have a mean of 7. What is the largest positive integer that could be one of them? Solution: 18 12 [Cayley 2007 Q6] You are told that one of the integers in a list of distinct positive integers is 97 and that their average value is 47. (a) If the sum of all the integers in the list is 329, what is the largest possible value for a number in the list? (b) Suppose the sum of all the numbers in the list can take any value. What would the largest possible number in the list be then? 2 ? [IMC 2006 Q15] What is the mean of 1. 2 and 2. 1 ? A 1. 6 B 1.666 C 1.665 D 1.6 5 E 1.65 Solution: A 13 ? 14 [SMC 2001 Q6] The mean of seven consecutive odd numbers is 21. What is the sum of the first, third, fifth and seventh of these numbers? ? Solution: (a) 217 (b) 1078 ? Solution: 84
Year 7 Stem and Leaf Diagrams Dr J Frost (jfrost@tiffin.kingston.sch.uk)
Stem and Leaf Diagram Suppose this stem and leaf diagram represents the lengths of beetles. The key tells us how two digits combine. 1 2 3 4 5 4 1 2 4 5 2 5 6 6 6 7 7 8 8 0 1 2 2 4 5 6 7 7 7 7 8 0 1 1 2 Key: 2 | 1 means 2.1cm The leaves must be in order. Value represented = 4.5cm ? These numbers (known as the stems ) represent the first digit of the number. These numbers (the leaves ) represent the second.
Example Here are the weights of a group of cats. Draw a stem-and-leaf diagram to represent this data. 36kg 15kg 35kg 50kg 11kg 36kg 38kg 47kg 12kg 30kg 18kg 57kg ? 1 1 2 5 8 Key: 3 | 8 means 38kg ? 2 ? ? 3 ? 0 5 6 6 8 What do you think are the advantages of displaying data in a stem-and-leaf diagram? 4 7 ? ? 5 0 7 Shows how the data is spread out. Identifies gaps in the values. All the original data is preserved (i.e. we don t summarise in any way). ?
Your turn Here is the brain diameter of a number of members of 8IW. Draw a stem and leaf diagram representing this data. 1.3cm 2.1cm 5.3cm 2.0cm 1.7cm 4.2cm 3.3cm 3.2cm 1.3cm 4.6cm 1.9cm ? 1 3 3 7 9 Key: 3 | 8 means 3.8cm ? 2 0 1 ? ? 3 ? 2 3 4 2 6 ? ? 5 3 ? ? Median = ?.? cm Mode = ?.? cm
Exercise 3 (on provided sheet) Here are the times, in minutes, taken to solve a puzzle. 1 5 10 15 12 8 7 20 35 24 15 20 33 15 24 10 8 10 20 16 10 (a) In the space below, draw a stem and leaf diagram to show these times. ? 0 5 7 8 8 0 0 0 0 2 5 5 5 6 ? 1 Key: 3|4 means 34 minutes ? ? 0 0 0 4 4 2 3 5 3 ? (b) Find the median time to solve this puzzle. 15 minutes ?
Exercise 3 (on provided sheet) The stem and leaf diagram gives information about the numbers of tomatoes on 31 tomato plants. 2 Work out the median. 32 tomatoes ?
Exercise 3 (on provided sheet) Here are the ages, in years, of 15 students. 3 19 18 20 25 37 33 21 17 29 20 42 18 23 37 22 Show this information in an ordered stem and leaf diagram. ? 7 8 8 9 1 0 0 1 2 3 5 9 ? 2 1|3 means 13 years ? ? 3 3 7 7 4 2 ?
Exercise 3 (on provided sheet) Here is the weight of 16 cats: 4 4.5kg 5.0kg 7.4kg 4.9kg 3.6kg 3.6kg 5.2kg 4.9kg 5.3kg 3.9kg 5.3kg 3.8kg 4.1kg 4.3kg 5.3kg (a) Produce an ordered stem and leaf diagram to show this information. ? 6 6 8 9 3 ? 1 3 5 9 9 4 ? Key: 3|6 means 3.6kg ? 5 0 2 3 3 3 ? 6 4 7 ? ? (b) What is the median weight? 4.9kg ? (c) What is the mode weight? 5.3kg
Year 7 Mean of Frequency Tables Dr J Frost (jfrost@tiffin.kingston.sch.uk)
Mean of Frequency Tables We know how to find the mean of listed data. What if we have a frequency table? Starting point: Suppose we listed this data out with duplicated values. What would be the total age of the dogs aged 10? Age of Dog Frequency ? ? ? ? ? ? 10 3 30 11 4 44 12 7 84 13 6 78 Once we d found the total, we d usually divide by the number of values. What is that? 21. A common mistake is to divide by 5 because there s 5 rows. But that s the number of unique values, and doesn t take into account duplicates. There s 21 dogs, not 5! 14 1 14 TOTAL 250 21 ? ???? =??? ? ??= 11.9
Test Your Understanding Cost Frequency 1.50 1 Mean cost of beefburger: = ??.?? ?? 1.65 20 = ?.?? ? 1.70 21 1.80 5 2.00 2 Weight Frequency Mean weight of cats: =?? ??= ?.?? ?? 2kg 4 3kg 0 ? 4kg 8 5kg 7 6kg 3
Mean of Grouped Data A number of members of 8EWS are running in a race. Their times were as follows Time (secs) Freq 225 ? ? ? ? 37.5 35 ? < 40 6 We don t know the individual times within each group. What time could we use for each person in the 35-40 group? 37.5? 45 40 ? < 50 12 540 60 50 ? < 70 9 ? 540 TOTAL 27 1305 ???? ??= ??.?? ?? ??? ? Estimate of mean: Because we don t know the exact times within each group. ? Why is it an estimate?
Test Your Understanding There are 25 people in a room who do 10 GCSEs and 5 people who do 12. What is the average number of GCSEs taken? Age of rock (years) Frequency ????? ????? = ?? ?? + ? ?? = ??? 0 a < 100 40 100 a < 400 24 ? ????? ?????? = ?? 400 a < 1000 5 ???? =??? ??= ??.?? GCSEs ???????? ?? ???? =11500 = 166.7 ????? ? 69
Combining Means We can use a similar approach when combining means. Class 7SM, with 30 students, got an average of 60 marks in a maths test. Class 7XQ, with 25 students, got an average of 75 marks in the same maths test. What was the average mark across all students? ????? ???? = ?? ?? + ?? ?? = ???? ????? ???????? = ?? ? ???? =???? = ??.? ??
Exercise 5 (on provided sheet) At a party, thirty people have an age of 30, forty have an age of 40 and fifty an age of fifty. What is their average age? ??.? ? Sam collects the weights of 15 squirrels and puts them into weight ranges. His data is presented below. Estimate the mean weight of a squirrel. 1 4 Weight Frequency 10-16kg 7 16-20kg 3 20-30kg 4 30kg-32kg 1 In a hardware shop, there are 30 spanners costing 6, 55 hacksaws costing 9 and 10 soldering irons costings 20. What is the average cost per item? ?.?? ? 2 ??.??? ? Miss Clarke values a number of pieces of artwork in the Tiffin School Vault. The price ranges are summarised below. Estimate the average value of a piece of art in school. 5 Using this frequency table, find the average height of a turnip. 3 Value Frequency 0- 1000 10 1 000-5 000 25 5 000- 20 000 6 20 000- 100 000 1 Height (nearest cm) Frequency 6cm 3 7cm 8 8cm 12 9cm 4 10cm 1 5119.05 ? ?.???? ? I record the times of 50 runners in a 10km race. Their times are summarised below. Determine their mean time in minutes. 6 Time (minutes) Frequency 35-40 5 40-42 15 42-48 20 48-60 10 44.85 minutes ?
Exercise 5 (on provided sheet) The 180 students of Year 7 have an average IQ of 124 and the 150 students of Year 8 have an average IQ of 95. What s the average IQ of all the students? 9 If I mix 2kg of substance A which contains 8% poison with 8kg of substance B which contains 2% poison, what percentage poison is the mixture? 7 ? ?.?? + ? ?.?? ? + ? i.e. ?.?% ??? ??? + ??? ?? ??? + ??? = ???.? ? = ?.??? ? 8 10 friends have an average of 5 dogs each. When 5 friends joined them the average number of dogs dropped to 4.6. What was the average number of dogs these extra five men had? ?? ?.? ?? ? ? = ?.? ?