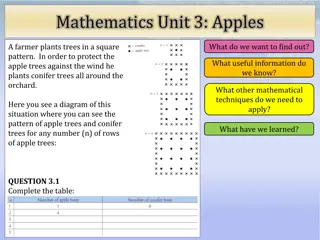
Analyzing Frequency Trees for Employee Break-time Requests
Analyzing the data presented in multiple frequency trees showing employees' preferences for coffee, tea, and biscuits during break-time. The information provided enables the completion of the frequency trees for different scenarios.

Download Presentation

Please find below an Image/Link to download the presentation.
The content on the website is provided AS IS for your information and personal use only. It may not be sold, licensed, or shared on other websites without obtaining consent from the author. Download presentation by click this link. If you encounter any issues during the download, it is possible that the publisher has removed the file from their server.
E N D
Presentation Transcript
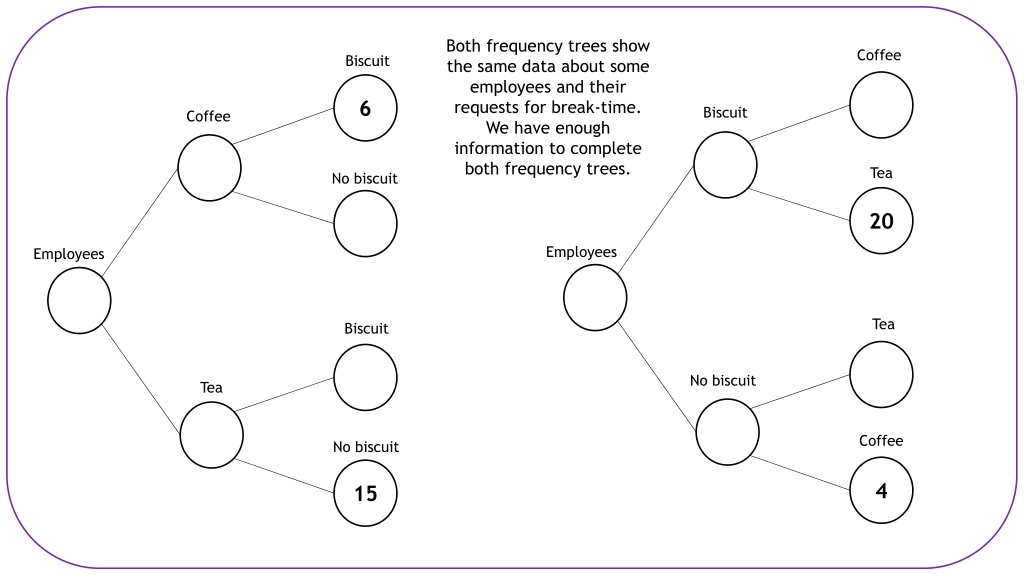
Both frequency trees show the same data about some employees and their requests for break-time. We have enough information to complete both frequency trees. Coffee Biscuit 6 Biscuit Coffee Tea No biscuit 20 Employees Employees Tea Biscuit No biscuit Tea Coffee No biscuit 4 15
Both frequency trees show the same data about some employees and their requests for break-time. We have enough information to complete both frequency trees. Coffee Biscuit 6 Biscuit Coffee Tea No biscuit 20 Employees Employees Tea Biscuit No biscuit Tea Coffee No biscuit 4 15
Both frequency trees show the same data about some employees and their requests for break-time. We have enough information to complete both frequency trees. Coffee Biscuit 6 Biscuit Coffee Tea No biscuit 20 Employees Employees Tea Biscuit 15 No biscuit Tea Coffee No biscuit 4 15
Both frequency trees show the same data about some employees and their requests for break-time. We have enough information to complete both frequency trees. Coffee Biscuit 6 6 Biscuit Coffee Tea No biscuit 20 Employees Employees Tea Biscuit 15 No biscuit Tea Coffee No biscuit 4 15
Both frequency trees show the same data about some employees and their requests for break-time. We have enough information to complete both frequency trees. Coffee Biscuit 6 6 Biscuit Coffee Tea No biscuit 20 4 Employees Employees Tea Biscuit 15 No biscuit Tea Coffee No biscuit 4 15
Both frequency trees show the same data about some employees and their requests for break-time. We have enough information to complete both frequency trees. Coffee Biscuit 6 6 Biscuit Coffee Tea No biscuit 20 4 Employees Employees Tea Biscuit 15 20 No biscuit Tea Coffee No biscuit 4 15
Both frequency trees show the same data about some employees and their requests for break-time. We have enough information to complete both frequency trees. Coffee Biscuit 6 6 Biscuit Coffee 26 10 Tea No biscuit 20 4 Employees Employees 45 45 Tea Biscuit 15 20 No biscuit Tea 19 35 Coffee No biscuit 4 15
Both frequency trees show the same data about some employees and their requests for break-time. We have enough information to complete both frequency trees. Coffee Biscuit 6 6 Biscuit Coffee 26 10 Tea No biscuit 20 4 Employees Employees 45 45 Tea Biscuit 15 20 No biscuit Tea 19 35 Coffee No biscuit 4 15
Both frequency trees show the same data about tickets bought to a museum. Complete both frequency trees. Adults Full day 16 Full day Adults 30 Children Half day 14 Visitors Visitors 45 Adults Full day 9 Half day Children 15 Children Half day 6
Wears glasses Both frequency trees show the same data about students that wear glasses. Complete both frequency trees. Male Wears glasses 3 Male Doesn t wear glasses 5 Female 2 Students Students Wears glasses Male Doesn t wear glasses 4 Female Doesn t wear glasses 5 Female
Both frequency trees show the same data about a fleet of vehicles and their colour. Complete both frequency trees. Truck White 1 White Truck Van Navy 18 Vehicles Vehicles Truck White 16 Navy Van 33 Van Navy
Counters Square Green 20 8 4 Green Triangle 12 7 Triangle Blue 7 13 Counters Counters 4 3 20 20 Square Green 3 4 3 5 Blue Square 5 5 Blue Green Blue Green 8 13 Blue Triangle 3 3 Three of these frequency trees show the same data. Which one doesn t? Triangle Triangle 3 4 Blue Green Counters Square Square 8 12 20 5 8
Both frequency trees show the same data about tickets bought to a museum. Complete both frequency trees. Adults Full day 16 16 Full day Adults 25 30 Children Half day 9 14 Students Visitors 45 45 Adults Full day 14 9 Half day Children 20 15 Children Half day 6 6
Wears glasses Both frequency trees show the same data about students that wear glasses. Complete both frequency trees. Male Wears glasses 3 3 Male Doesn t wear glasses 5 7 Female 2 4 Students Students 12 12 Wears glasses Male Doesn t wear glasses 4 2 Female 7 Doesn t wear glasses 5 Female 3 3
Both frequency trees show the same data about a fleet of vehicles and their colour. Complete both frequency trees. Truck White 1 1 White Truck 19 17 Van Navy 18 16 Vehicles Vehicles 50 50 Truck White 16 18 Navy Van 31 33 Van Navy 15 15
Counters Square Green This is different than the other three because of the labels of green and blue squares compared to those boxed in the second frequency tree 20 8 4 Green Triangle 12 7 Triangle Blue 7 13 Counters Counters 4 3 20 20 Square Green 3 4 3 5 Blue Square 5 5 Blue Green Blue Green 8 13 Blue Triangle 3 3 Three of these frequency trees show the same data. Which one doesn t? Triangle Triangle 3 4 Blue Green Counters Square Square 8 12 20 5 8
Wears glasses What s the difference between these two questions? 3 Male Doesn t wear glasses 7 What fraction of males wear glasses? What fraction of students are males who wear glasses? 4 Students 12 Wears glasses 2 Female Doesn t wear glasses 5 3
Wears glasses What s the difference between these two questions? 3 Male Doesn t wear glasses 7 What fraction of males wear glasses? What fraction of students are males who wear glasses? 4 Students 12 Wears glasses 2 Female Doesn t wear glasses 5 7 3
Wears glasses What s the difference between these two questions? 3 Male Doesn t wear glasses 7 What fraction of males wear glasses? What fraction of students are males who wear glasses? 4 Students 12 Wears glasses 2 Female 3 7 7 Doesn t wear glasses 5 3
Wears glasses What s the difference between these two questions? 3 Male Doesn t wear glasses 7 What fraction of males wear glasses? What fraction of students are males who wear glasses? 4 Students 12 Wears glasses 2 Female 3 7 Doesn t wear glasses 5 12 3
Wears glasses What s the difference between these two questions? 3 Male Doesn t wear glasses 7 What fraction of males wear glasses? What fraction of students are males who wear glasses? 4 Students 12 Wears glasses 2 Female 3 3 7 Doesn t wear glasses 5 12 12 3
Wears glasses What s the difference between these two questions? 3 Male Doesn t wear glasses 7 What fraction of females wear glasses? What fraction of glasses wearers are female? 4 Students 12 Wears glasses 2 Female Doesn t wear glasses 5 3
Wears glasses What s the difference between these two questions? 3 Male Doesn t wear glasses 7 What fraction of females wear glasses? What fraction of glasses wearers are female? 4 Students 12 Wears glasses 2 Female Doesn t wear glasses 5 5 3
Wears glasses What s the difference between these two questions? 3 Male Doesn t wear glasses 7 What fraction of females wear glasses? What fraction of glasses wearers are female? 4 Students 12 Wears glasses 2 Female 2 5 5 Doesn t wear glasses 5 3
Wears glasses What s the difference between these two questions? 3 Male Doesn t wear glasses 7 What fraction of females wear glasses? What fraction of glasses wearers are female? 4 Students 12 Wears glasses 2 Female 2 5 Doesn t wear glasses 5 2 + 3 3
Wears glasses What s the difference between these two questions? 3 Male Doesn t wear glasses 7 What fraction of females wear glasses? What fraction of glasses wearers are female? 4 Students 12 Wears glasses 2 Female 2 5 Doesn t wear glasses 5 5 3
Wears glasses What s the difference between these two questions? 3 Male Doesn t wear glasses 7 What fraction of females wear glasses? What fraction of glasses wearers are female? 4 Students 12 Wears glasses 2 Female 2 2 5 Doesn t wear glasses 5 5 5 3
Takes the bus A frequency tree diagram shows the number of students that take the bus to school and don t. 11 Complete the table. Female Doesn t take the bus 40 What fraction of students are male? 29 What fraction of females take the bus? Students What fraction of students are females that take the bus? 76 Takes the bus What fraction of males take the bus? 17 Male What fraction of students are males who don t take the bus? Doesn t take the bus 36 What fraction of students don t take the bus? 19 What fraction of males don t take the bus?
A frequency tree diagram shows the number of students that ordered meals and whether they are vegetarian or not. Meat Ordered pizza 7 Complete the table. 15 Vegetarian 8 15 8 What fraction of students ordered vegetarian pizza? Students 1 19 19 Meat What fraction of those that ordered sandwiches are not vegetarian? Ordered sandwiches 1 15 19 4 Vegetarian What fraction of students that ordered pizza are not vegetarian? 3 3 4
A frequency tree diagram shows the number of counters and their colour and shape. Square 8 Complete the table. Green 12 What fraction of blue counters are squares? Triangle 4 3 Counters 20 What fraction of blue counters are triangles? 20 Square 13 20 5 Blue What fraction of squares are green? 8 Triangle What fraction of greens are squares? 3 1 3
Likes hot chocolate A frequency tree diagram shows the number of students that like hot chocolate and like tea. Likes tea Complete the frequency tree and the table Doesn t like hot chocolate 27 3 80 53 80 21 80 3 40 3 53 5 8 2 3 6 Students 80 Likes hot chocolate Doesn t like tea Doesn t like hot chocolate 3
Takes the bus A frequency tree diagram shows the number of students that take the bus to school and don t. 11 Complete the table. Female Doesn t take the bus 40 36 76 11 40 11 76 17 36 19 76 48 76 19 36 What fraction of students are male? 29 What fraction of females take the bus? Students What fraction of students are females that take the bus? 76 Takes the bus What fraction of males take the bus? 17 Male What fraction of students are males who don t take the bus? Doesn t take the bus 36 What fraction of students don t take the bus? 19 What fraction of males don t take the bus?
A frequency tree diagram shows the number of students that ordered meals and whether they are vegetarian or not. Meat Ordered pizza 7 Complete the table. 15 Vegetarian 8 What fraction of pizza orders where vegetarian? 15 8 19 1 19 1 4 15 19 7 15 3 4 8 What fraction of students ordered vegetarian pizza? Students What fraction of students ordered meat sandwiches? 19 Meat What fraction of those that ordered sandwiches are not vegetarian? Ordered sandwiches 1 What fraction of students ordered pizza? 4 Vegetarian What fraction of students that ordered pizza are not vegetarian? 3 What fraction of sandwich orders were vegetarian?
A frequency tree diagram shows the number of counters and their colour and shape. Square 8 Complete the table. Green 12 5 8 3 What fraction of blue counters are squares? Triangle 4 What fraction of counters are blue triangles? Counters 20 3 8 13 20 8 13 What fraction of blue counters are triangles? 20 Square What fraction of counters are squares? 5 Blue What fraction of squares are green? 8 12=2 1 3 8 Triangle What fraction of greens are squares? 3 3 What fraction of greens are triangles?
Likes hot chocolate A frequency tree diagram shows the number of students that like hot chocolate and like tea. 21 Likes tea Complete the frequency tree and the table Doesn t like hot chocolate 27 3 What fraction of students don t like hot chocolate? 80 53 80 21 80 3 40 3 53 5 8 2 3 6 What fraction of students don t like tea? Students What fraction of students like tea and hot chocolate? 80 Likes hot chocolate What fraction of students like tea but don t like hot chocolate? Doesn t like tea 50 What fraction of pupils that don t like tea also don t like hot chocolate? Doesn t like hot chocolate 53 What fraction of students don t like tea but do like hot chocolate? 3 What fraction of people that don t like hot chocolate do like tea?
The information below describes the number of short and long tent pegs that are broken or not broken in shop stockroom. Long Complete the frequency tree Broken Short 53 150 of the pegs are broken Pegs 51 150 of the of the pegs are long and not broken Long 3 10 of the pegs are long and broken Not broken There are 96 long pegs Short 4 26 of the short pegs are broken
Red A company has ordered badges with their logo on. There is a choice of two shapes and three colours. Square Yellow Use the information below to complete the frequency tree 1 4 of the badges are circles Blue 1 4 of the badges are red 1 4 of the of the red logos are circles 1 4 of the circles are red Badges 1 4 of the squares are yellow Red 1 4 of the badges are yellow 1 4 of the blue logos are circles 1 4 of the circles are yellow Circle Yellow 1 Blue
The information below describes the number of short and long tent pegs that are broken or not broken in shop stockroom. Long 45 Complete the frequency tree Broken 53 Short 53 150 of the pegs are broken 8 Pegs 51 150 of the of the pegs are long and not broken 150 Long 3 10 of the pegs are long and broken Not broken 51 There are 96 long pegs 97 Short 4 26 of the short pegs are broken 46
Red A company has ordered badges with their logo on. There is a choice of two shapes and three colours. 3 Square Yellow Use the information below to complete the frequency tree 12 3 1 4 of the badges are circles Blue 1 4 of the badges are red 6 1 4 of the of the red logos are circles 1 4 of the circles are red Badges 16 1 4 of the squares are yellow Red 1 4 of the badges are yellow 1 1 4 of the blue logos are circles 1 4 of the circles are yellow Circle Yellow 4 1 Blue 2