Insights into Service and Information Requests Handling in May 2024


May 2024
Public


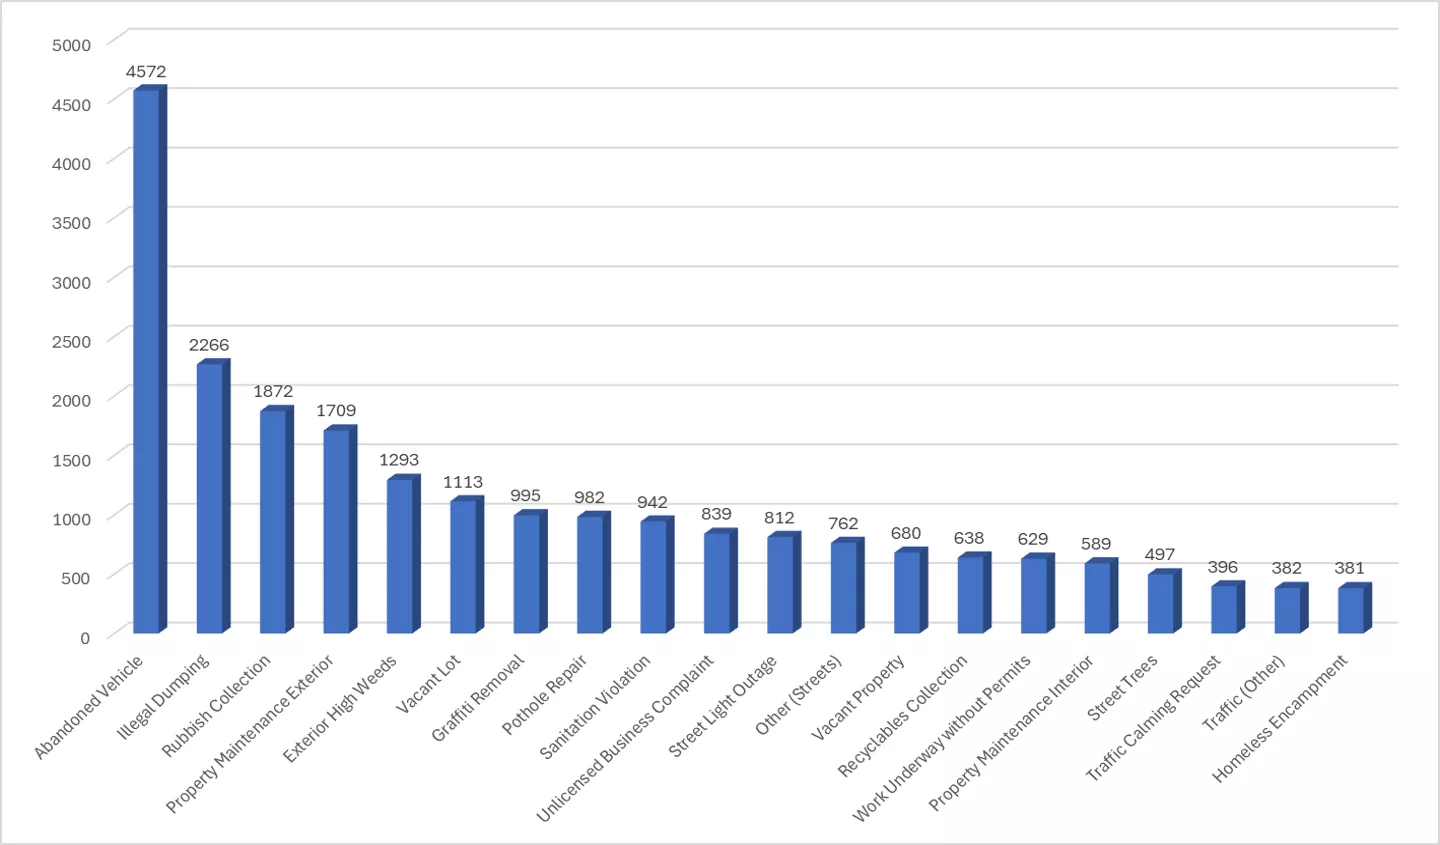
Top 20 Service Requests of the 27,752 Total Cases Submitted
Top 20 Information Requests of the 25,941 Total Cases Submitted
Service Requests by Department of the
27,752
Total Cases Submitted
“Service Level”
is the percentage of calls answered in less than 30 seconds. Our goal is 50%.
“Average Speed of Answer
” is the average wait time the call experiences in queue.
Philly311 Call Volumes, Abandons and Service Level by Day
Delve into the data of service and information requests submitted in May 2024, showcasing the top 20 service requests, top 20 information requests, service requests by department, and Philadelphia's 311 call volumes, abandons, and service levels. This detailed analysis provides a snapshot of the calls handled, service level achievements, and average response times, offering valuable insights into operational efficiency and customer service strategies.

Download Presentation

Please find below an Image/Link to download the presentation.
The content on the website is provided AS IS for your information and personal use only. It may not be sold, licensed, or shared on other websites without obtaining consent from the author. Download presentation by click this link. If you encounter any issues during the download, it is possible that the publisher has removed the file from their server.
E N D
Presentation Transcript
May 2024 Public
Top 20 Information Requests of the 25,941 Total Cases Submitted
Service Requests by Department of the 27,752 Total Cases Submitted
Philly311 Call Volumes, Abandons and Service Level by Day Week 3 (5/12- 5/18) Week 4 (5/19- 5/25) Week 5 (5/26- 5/31) Week 2 (5/5-5/11) Week 1 (5/1-5/4) May 2024 Calls Handled Service Level (Goal 50%) Average Speed of Answer (Goal <30s) 5:04 Average Talk Time 4,513 50% 7,577 48% 5:02 4:36 7,619 46% 4:59 4:34 7,997 30% 5:01 4:35 6,542 26% 4:52 4:27 4:40 Service Level is the percentage of calls answered in less than 30 seconds. Our goal is 50%. Average Speed of Answer is the average wait time the call experiences in queue.