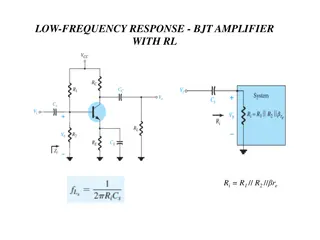
Understanding Two-Way Frequency Tables in Data Analysis

Explore the concept of representing and interpreting data in two variables using two-way frequency tables. Learn about joint frequency, marginal frequency, and conditional relative frequency through a practical example involving gender and nail services. Discover how to target specific audiences based on data analysis.

Download Presentation

Please find below an Image/Link to download the presentation.
The content on the website is provided AS IS for your information and personal use only. It may not be sold, licensed, or shared on other websites without obtaining consent from the author. Download presentation by click this link. If you encounter any issues during the download, it is possible that the publisher has removed the file from their server.
E N D
Presentation Transcript
Lesson 4.4 Two-Way Frequency Tables Concept: Representing and Interpreting Data EQ: How do we represent and interpret data in two variables? (Standard S.ID.5) Vocabulary: Two-Way Frequency Table, Bivariate, Joint Frequency, Marginal Frequency, Conditional Relative Frequency http://www.youtube.com/watch?feature=player_embeddedv=SsWrY77o77o 1 http://www.youtube.com/watch?feature=player_embedded&v=SsWrY77o77o 4.2.1: Summarizing Data Using Two-Way Frequency Tables
Guided Practice - Example 1 Say you own your own nail salon and you are looking at some advertising options. You want to know which gender and which service is the most popular so you can target a particular audience. You look at your records from the last month and you find the following: 58 females manicure 77 females pedicure 31 males manicure 27 males pedicure How could you display this data? 2 4.2.1: Summarizing Data Using Two-Way Frequency Tables
Introduction Information about people who are surveyed can be captured in two-way frequency tables. A two-way frequency table is a table of data that compares two variables (bivariate). It separates responses by a characteristic of the respondents. Gender Nail Service Females Males Total Manicure 58 31 89 Pedicure 77 27 104 Total 135 58 193 3 4.2.1: Summarizing Data Using Two-Way Frequency Tables
Vocabulary A joint frequency is the number of responses for a given characteristic. The entries in the cells of a two-way frequency table are joint frequencies. In our table, 58, 77, 31, and 27 are each joint frequencies. Gender Nail Service Females Males Total Manicure 58 31 89 Pedicure 77 27 104 Total 135 58 193 4 4.2.1: Summarizing Data Using Two-Way Frequency Tables
Vocabulary A marginal frequency is the total number of times a response was given, or the total number of respondents with a given characteristic. This is the sum of either a row or a column in a two- way frequency table. In our table, 89, 104, 135, and 58 are all marginal frequencies. Nail Service Gender Females Males Total Manicure 58 31 89 Pedicure 77 27 104 Total 135 58 193 5 4.2.1: Summarizing Data Using Two-Way Frequency Tables
Gender Nail Service Females Males Total Manicure 58 31 89 Pedicure 77 27 104 Total 135 58 193 Looking at our table, who and what service would you target? Your answer probably involved the highest total between the genders and the highest total between the services, but is this really accurate? The only way to know for sure is to calculate the conditional relative frequencies for each joint frequency. 6 4.2.1: Summarizing Data Using Two-Way Frequency Tables
Vocabulary A conditional relative frequency expresses a number of responses as a percentage of the total number of responses. It allows a comparison to be made for multiple responses in a single row, single column, or table. They are found by dividing the number of responses by the total number of responses. Three conditional relative frequencies can be found for each joint frequency (one for each characteristic and one for the total people surveyed). In our table, you can do it with respect to gender, to the service, or to the total people surveyed. 7 4.2.1: Summarizing Data Using Two-Way Frequency Tables
Conditional Relative Frequency Gender Conditional relative frequency with respect to gender. Nail Service Females Males 31 58= .53 = ??% 27 58= .47 = ??% 58 135= .43 = ??% 77 135= .57 = ??% Manicure Pedicure Would you change your mind about who and what service to target? Gender Conditional relative frequency with respect to nail service. Nail Service Females Males 31 89= .35 = ??% 27 104= .26 = ??% 58 89= .65 = ??% 77 104= .74 = ??% Manicure Pedicure Conditional relative frequency with respect to all people. Gender Nail Service Females Males 31 193= .16 = ??% 27 193= .14 = ??% 58 193= .30 = ??% 77 193= .40 = ??% Manicure Pedicure
Guided Practice - Example 2 Abigail surveys students in different grades, and asks each student which pet they prefer. Their responses are in the table below. Preferred pet Cat 49 36 Grade Bird 3 7 Dog 53 64 Fish 22 10 9 10 1. How many 9th graders preferred fish? 2. What does the joint frequency 7 represent? 3. What is the joint frequency of 9th graders who preferred cats? 4. Which pet was the most popular among all the students surveyed? 9 4.2.1: Summarizing Data Using Two-Way Frequency Tables
Guided Practice: Example 2, continued 5. Complete the marginal frequencies for each type of pet and for each grade level. Which one is the smallest? Preferred pet Cat 49 36 Grade Bird 3 7 Dog 53 64 Fish 22 10 Total 9 10 Total 6. How many students are represented in the survey? 7. What would the conditional relative frequency be for 9th graders who preferred cats (with respect to 9th graders)? 8. What would the conditional relative frequency be for fish (with respect to everyone surveyed)? 10 4.2.1: Summarizing Data Using Two-Way Frequency Tables
Guided Practice - Example 3 Deshaun surveyed the seniors at his high school to find out who eats and doesn t eat breakfast regularly. Their responses are in the table below. Gender Female Breakfast habits Male Totals Eat Breakfast regularly Do not Eat Breakfast regularly Totals 190 110 300 130 165 295 320 275 595 1) How many females eat breakfast regularly ? _____ This is a ____________ frequency 2) 275 is a _____________ frequency. It represents _____________________________________________. 11 4.2.1: Summarizing Data Using Two-Way Frequency Tables
Guided Practice - Example 3 (continued) Gender Female Breakfast habits Male Totals Eat Breakfast regularly Do not Eat Breakfast regularly Totals 190 110 300 130 165 295 320 275 595 3) How many people were included in this survey? ______ 4) Complete the table by calculating the conditional relative frequencies with respect to gender. 5) What can you conclude about the breakfast habits of males and females? 12 4.2.1: Summarizing Data Using Two-Way Frequency Tables
You Try! . 1. Looking at just the marginal frequencies (row & column totals) what can we conclude about the 3 activities? A. Dance is way more interesting. B. They have roughly equal appeal. C. Sports is the least chosen activity. D. TV is the preferred activity. 2. Looking at the joint frequencies we see that women show a strong preference for which activity? 3. What are the conditional relative frequencies (for both gender and hobby) for men who showed a preference for Sports? 13 4.2.1: Summarizing Data Using Two-Way Frequency Tables
Message to Absent Student Suppose a friend of yours in this class was absent today and missed this lesson They send you a text message later asking you what they missed and how do they do the homework. Write or text me your response to them. *If texting use this #37607 and I ll give you the code#. 14 4.2.1: Summarizing Data Using Two-Way Frequency Tables
Message to Absent Student Suppose a friend of yours in this class was absent today and missed this lesson They send you a text message later asking you what they missed and how do they do the homework. Write or text me your response to them. *If texting use this #37607 and I ll give you the code#.


")