Impact of Frequency Oscillation on Generator Operation: Emergency Conditions Analysis

Analyzing the impact of frequency oscillation and low frequency on generator operation during emergency conditions. Investigating how lower frequency affects units' ability to respond to deviations, system stability, and load shedding processes. Examining system responses during Energy Emergency Alert events and the elements of PRC calculation.

Download Presentation

Please find below an Image/Link to download the presentation.
The content on the website is provided AS IS for your information and personal use only. It may not be sold, licensed, or shared on other websites without obtaining consent from the author. Download presentation by click this link. If you encounter any issues during the download, it is possible that the publisher has removed the file from their server.
E N D
Presentation Transcript
DRAFT OPEN Session Version 9/30/21 Impact of Frequency Oscillation and Low Frequency on Generator Operation ROS#45 Emergency Conditions List The information transmitted is intended only for the person(s) to which it is addressed and may contain confidential and/or privileged material. Any review, retransmission, dissemination, or other use of or taking of any action in reliance upon this information by persons other than the intended recipient is prohibited. 1
ROS#45 Emergency Conditions List Frequency: Analyze system frequency leading up to Energy Emergency Alert conditions and determine impact of low frequency on generation and load tripping. 2
Team Members Percy Galliguez Brazos Electric Power Cooperative David Penney Texas Reliability Entity Bailey Barksdale Lower Colorado River Authority Albert Laurents Lower Colorado River Authority John Dumas Lower Colorado River Authority Bracy Nesbit - Lower Colorado River Authority 3
Issues Investigated 1) How did the lower frequency affect a unit s ability to respond to larger frequency deviations? 2) What is the impact of continued unstable frequency deviations on unit control systems? Review underfrequency relay setting coordination with loads and generators 3) During the EEA event how did load sources respond at 59.7Hz and 59.3Hz? 4) What was the status of Regulation, RRS (Load and Generation), and Non- Spin? 5) How did the Load shed process impact frequency? 6) What was the cause of unit trips during the event ? 7) What are the elements of the PRC calculation? 8) 4
1) How did the lower frequency affect a units ability to respond to larger frequency deviations? a) Transient Impact: The changing frequency outside the deadband caused the rotating units to start then to reverse turbine governor action which reduced the unit s ability to respond to further deviations. Graph 1a1: shows the frequency transients and the initiation of imbalance which drives frequency lower. Graph 1a2: the frequency continues to decay and become increasingly unstable which started units to swing. Graph 1a3: the frequency nadir is shown along with the needed load sheds to stabilize system. Graph 1a4: the ERCOT Graph shows lack of governor response and trips during the frequency transient. 5
Frequency Becoming Unstable Graph 1a1 Frequency dip reduces governors' ability to respond to real FME due to loss of generation resource 6
Load Shed Needed to Recover Frequency [9] Graph 1a2 7
Needed to Stabilize Frequency [9] Graph 1a3 Multiple Low Sheds System Demand PRC 8
The Graph below shows lack of governor response during the frequency transient. Governor Response & Tripped During Event Graph 1a4 Units Unable to Provide 9
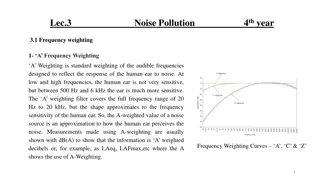
b) Impact on Turbine Components Low frequency operation below 59.6 Hz damage to blading is cumulative and reduces the life of the turbine blade. The damage incurred often is discovered during subsequent maintenance inspections where fatigue cracks are found using nondestructive examination techniques. The impact of lower frequencies and the issues are presented in IEEE 37.106 [2]. While there is an impact on LP turbine blades at frequencies near 59.4 Hz, operating for short durations at frequencies between 59.6 Hz and 60 Hz do not have a significant effect on unit damage if the frequency is stable. 10
c) Impact on Generator Components The large generator industry has recognized for many years end winding systems have natural frequencies near to the excitation frequency of 60 Hz[3]. To avoid unstable operating modes the end winding blocking is de-tuned on both sides of 60 Hz. Additionally, Low Pressure turbine vibration due to blade resonant vibration exacerbates generator end winding vibration. Generator end winding damage is normally found during a subsequent maintenance outage after the frequency event and is usually evident with insulation dusting or greasing on end winding and blocking components. Units equipped with fiber optic vibration monitors can see increased vibration after an event and a possible shift in natural frequency. The winding insulation wear and damage increases repair costs and may require de-tuning of the basket and phase blocking. Additionally, torsional vibration excited by power oscillation and transients results in damage to generator rotor components. The damage is found in winding slot insulation, turn to turn insulation, and rotor forging components. 11
2) What is the impact of continued unstable frequency deviations on unit control systems? 2a)Dynamic Impact Power & Voltage: The oscillating frequency outside the deadband caused the rotating units to start turbine governor action which triggered responses from the boiler firing controls, drum level controls, steam temperature controls, and excitation system controls. The turbine governor increase and decrease repetitions resulted in power oscillations which also manifested into voltage oscillations. See Graph 2a1, Graph 2a2, & Graph 2a3 for Power and Voltage swings. 12
Fluctuations in unit MW Output Due to Frequency Fluctuations Graph 2a1 - Power & Voltage Transients [9] System Voltage Transients 13
Plant Reactive Power Response to Voltage Transients [9] Unit Reactive Power Responding to Voltage Transients Graph 2a2 14
Graph 2a3 Power & Voltage Swing [9] System Demand/Load 15
2b) Dynamic Impact Drum Level Controls: For steam drum units the drum level controls are very sensitive to system oscillations. When the drum level oscillations increase to an unstable point the automatic drum level controls transfer to manual. Operator normal reaction is usually to reduce steam flow so a new stable point can be established and the automatic drum level put back in service. Drum level swings are a major contributor to steam unit trips. See Graph 2b1 for Power Transients and Graph 2b2 for drum level swings. 16
Fluctuations in unit MW Output Due to Frequency Fluctuations Graph 2b1 Control System Swing System Demand 17
Graph 2b2 Control System Swing With Drum Level Drum Level Fluctuation Due to Frequency Fluctuation 18
2c) Dynamic Impact BAL-001-TRE-002: In recent years control systems have been tuned to respond to frequency events so that they pass the BAL-001-TRE-002 scoring criteria. This tuning has made control systems more vulnerable to unstable operating modes when the frequency is continually oscillating in and out of the 17 mHz deadband. When frequency oscillations exceed 36 mHz control systems are susceptible to unstable swings which inhibit their response to real frequency events due to a loss of significant load. 19
3) How is the underfrequency relay settings coordinated with loads and generators? The underfrequency relay settings have been established for many years and it was commonly thought that the system frequency would never pause between 59.4 Hz and 59.3 Hz; however, we all now know it can and have observed the countdown to the total collapse of the grid. In slides 12 and 13 the damage of underfrequency operation below 59.6 Hz is discussed. The trip at 59.4 Hz after 9 minutes is to protect the units from immediate damage which would prevent the grid from being quickly restored to normal capacity after an event. The miscoordination must be addressed as soon as possible to allow the automatic load shed steps to function correctly. 20
Graph 3 Unfrequency Relay Settings Miscoordination [5] 21
4) During the EEA event how did load sources respond at 59.7 Hz and 59.3 Hz? a) Transient Impact: The deployment of ~70 MWs at 59.7 Hz is shown in Graph 3a1. It is not clear how the allotment was determined or if it is simply the measure of the NPF down- ramp. In the Graph-3a2 provided by ERCOT includes a notation indicating 1106 MWs RRS of load resources were deployed at 1:11AM of Feb 15th preceding the 59.7 Hz point. NPF = Net Power Flow RRRS = Responsive Reserve Responsibility Schedule. 22
Graph 4a1 Load Resource Deployment when frequency dropped below 59.7Hz [4] 23
Graph 4a2 Load Resource Deployment during EEA Event [4] 24
5) What was the status of Regulation, RRS (Load and Generation), and Non-Spin? Approximately 200 MW Regulation UP was available during the event. It provided little control of frequency. In Graph-4 the data from the ICCP indicates that the majority of REG-UP was deployed in addition to any small amount FFR (according to ERCOT FFR was all deployed). The 1106 MWs Load Resources deployed at 1:11am is shown also in Graph 3a2. 25
Graph 5 Load Resource Deployment during EEA Event [4][8] 26
6) How did the Load shed process impact frequency? Load shedding large blocks to a strained grid can further push individual unit stability closer to an uncontrolled trip. Unit instability is shown in Graphs 2b1 and 2b2 as large frequency transients cause units to swing. Load shed plans should be a stepped process to ensure that unstable frequency control is avoided. 27
7) What was the cause of unit trips during the event ? ERCOT supplied a list of unit trips with cause statements provided by Generators. Most of the statements indicated the root cause was unknown. To add to the confusion several of the time stamps and causal statements seem to be contradicting or incomplete. There are indications that six units recognized they were tripped off due to unit swinging conditions. These do not include the two units that tripped during frequency nadir transient shown in Graph 1a4. 28
8) What are the elements of the PRC calculation? PRC is calculated per the Nodal Protocol 6.5.7.2. The instantaneous PRC is available on the ICCP and on the ERCOT dashboard: System Ancillary Service Capacity Monitor. The PRC equation is composed of 7 factors based on unit conditions and adjustment factors. Factor that are not included are the affects of frequency oscillations outside the deadband and repetitions of multiple transients. It is recognized that accurate PRC is an important parameter for ERCOT to manage the grid. The challenge is that during dynamic grid operation it is difficult for generator operators to determine accurate unit capability. Unit stability is directly related to grid stability. Even more challenging is to predict forward unit capability without knowing how stable the grid will be in 15 minutes. 29
Recommendations 1) ERCOT to perform studies to: determine how much regulation service will be needed to preserve a stable frequency. add a criteria to adjust regulation service procured due to projected adverse weather tune Regulation controls to better respond to deviations; this will include normal conditions, daily wind/solar ramps, and abnormal conditions. 2) ERCOT to review the impact of the impending broadening of governor controls deadband to maintaining stable frequency control. 3) ERCOT to complete a review and analysis of large load shed increments: impact on frequency and system stability (related to ECL 42) ERCOT instructed and rotating process (related to ECL 30 & ECL 4) 4) ERCOT to review the possibility of changing the EEA Triggers to: EEA1 -2700 MW, EEA2 2300 MW, and EEA3 - 1750 MW to provide adequate time for recovering reserves. 5) ERCOT to provide proposals to simplify unit status reporting and critical data that may be needed. It is suggested that terminology be compatible with IEEE 762 [7]. (related to ECL 6) 6) ERCOT to review PRC calculation methods with PDCWG. The objective is to investigate more options to improve system reliability with regard to frequency stability and generator telemetry. 30
References: [1] Mago, Nitika, April 8, 2021, FEB 2021 WINTER EVENT RRS DEPLOYMENT PRC NON FME REPORTS, Presented at the April 8, 2021 ERCOT PDCWG [2] C37.106 IEEE Guide for Abnormal Frequency Protection for Power Generating Plants [3] IEEE 1129 IEEE Guide for Online Monitoring of large Generators [4] Mago, Nitika, July 15, 2021, EMAIL: ROS Emergency Conditions List PDCWG #45 Item [5] NERC, May 29, 2015, PRC-024-2 - Generator Frequency and Voltage Protective Relay Settings [6] ERCOT, June 1, 2021, Nodal Operating Guide section 2.6.2 Generators (Under- Frequency Protective Relay Settings) [7] IEEE 762 IEEE Standard Definitions for Use in Reporting Electric Generating Unit Reliability, Availability, and Productivity [8] Mago, Nitika, August 6, 2021, EMAIL: ROS Emergency Conditions List PDCWG #45 Item [9] Review of February 2021 Extreme Cold Weather Event ERCOT Presentation, ERCOT, Bill Magness, February 24, 2021 (referenced for event times) 31


 How did the lower frequency affect a unit’s ability")


 Impact on Turbine Components")
 Impact on Generator Components")
 What is the impact of continued unstable")


 Dynamic Impact – Drum Level Controls:")


 Dynamic Impact – BAL-001-TRE-002:")
 How is the underfrequency relay settings")

 During the EEA event how did load sources")


 What was the status of Regulation, RRS (Load")

 How did the Load shed process impact")
 What was the cause of unit trips during the event ?")
 What are the elements of the PRC calculation?")