Understanding Break-Even Analysis for Small Business - A Practical Example
This session covers the essentials of break-even analysis, using Claire's Hairdressers as a case study. Learn how to calculate fixed costs, variable costs, contribution per unit, and determine the break-even point in units. Follow step-by-step instructions to plot a break-even graph and watch a YouTube video for further clarification. Test your knowledge with a break-even quiz and reinforce your learning with a recap of the session's aims and objectives.

Download Presentation

Please find below an Image/Link to download the presentation.
The content on the website is provided AS IS for your information and personal use only. It may not be sold, licensed, or shared on other websites without obtaining consent from the author. Download presentation by click this link. If you encounter any issues during the download, it is possible that the publisher has removed the file from their server.
E N D
Presentation Transcript
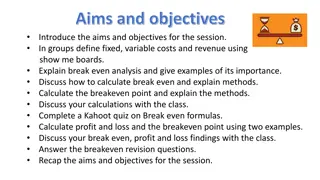
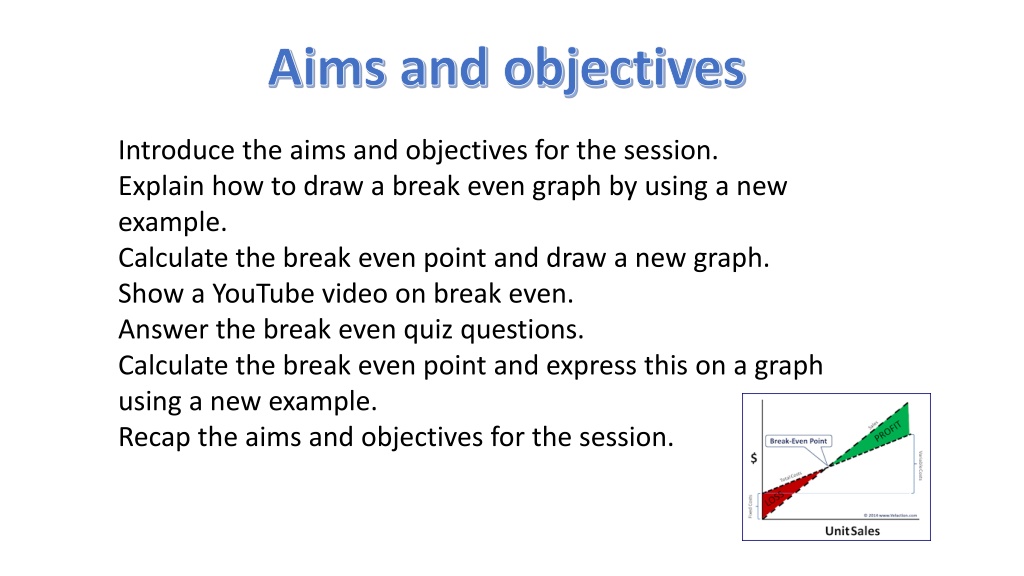
Aims and objectives Introduce the aims and objectives for the session. Explain how to draw a break even graph by using a new example. Calculate the break even point and draw a new graph. Show a YouTube video on break even. Answer the break even quiz questions. Calculate the break even point and express this on a graph using a new example. Recap the aims and objectives for the session.
Break even scenario example Claire s Hairdressers 1) point for the example below and express this on a graph (10) You are required to calculate the breakeven
Claire's hairdressers financials The costs he has researched are as follows: Insurance and road tax - 450 per month; Van rental - 500 per month, Utility bills - 1,000 per month Average cost of each item 5.00; Salaries - 1,800 per month; loan repayment 1,000 per month for twelve months. Rent for the shop - 750 per month His market research indicates that each item will have an average sales price of 15.00.
Fixed costs calculation Fixed costs Insurance and road tax 450 per month; Van rental - 500 per month, Utility bills - 1,000 per month Salaries - 1,800 per month; loan repayment 1,000 per month for twelve months. Rent for the shop - 750 per month Total fixed costs - 5,500
Variable costs and sales revenue Variable costs Average cost of each item 10.00; Total Variable costs - 5.00 per item Sales revenue 15 per item
Break even formula Break-even output = Fixed costs Contribution per unit. Contribution per unit = Selling price Variable costs (per unit)
Break even calculation Break even in units = 5,500 15 - 5 Break even in units = 5,500 / 10 Break even in units = 550 items
BE graph calculations Fixed costs Plot horizontal on graph 5,500
Variable costs Plot vertical on graph Number of units x variable costs = Variable cost per number of units Point 1 Zero Point 2 - 800 = 800 x 5 = 8,000 Point 3 1,200 = 1,200 x 5 = 12,000
Total costs Plot vertical on graph Total costs = Fixed costs + variable costs at selected number of units Point 1 Fixed costs Point 2 Units 800 = 5,500 + (800 x 5) = 9,500 Point 3 Units 1,200 = 5,500 + (1,200 x 5) = 11,500
Revenue Plot vertical on graph Why? Revenue = quantity sold x selling price Point 1 Zero Point 2 - 800 x 15 = 12,000 Point 3 1,200 x 15 = 18,000
Break even point Breakeven point - Where profit line and total costs line intersect. Plot and join up revenue and output. NOTE : Make sure each are in correct place. TIP : PLOT DOTS ON GRAPH FIRST TO MAKE SURE LINES UP
Draw break even graph Draw Break even graph on board and in books.
Activity 5 Task: Calculate the breakeven point. Draw a break even graph. Calculate the profit and loss. Time: 30 mins and 5 mins discussion.
YouTube video https://www.youtube.com/watch?v=TLOo2mY6FIw
Activity 6 Task: Break even quiz questions Time: 15 mins
Activity 7 Task: Calculate the breakeven point. Draw a break even graph. Calculate the profit and loss. 30 mins and 5 mins discussion.
Break even graph questions 1)What is the break even formula? 2)The break even is point is when lines cross ? 3)The horizontal axis are marked? 4)The vertical axis are marked? 5)The Fixed costs line is ? Why?
6) The Variable cost line is ? Why? 7) The total cost line starts from ? Why ? 8) The revenue line starts from ? 9) The break even point is marked where on the graph? 10) Why is it important to always give your graph a heading?
Aims and objectives Introduce the aims and objectives for the session. Explain how to draw a break even graph by using a new example. Calculate the break even point and draw a new graph. Show a YouTube video on break even. Answer the break even quiz questions. Calculate the break even point and express this on a graph using a new example. Recap the aims and objectives for the session.


 The Variable cost line is ? Why?")