Understanding Chi-Square Goodness of Fit Tests in Statistics
Explore the significance of Chi-square goodness of fit tests in statistics. Learn how to differentiate between random noise and actual trends, when to use a Chi-square test, and how to interpret the results. Dive into the core issues and examples associated with Chi-square tests along with a Chi-square probability table. Gain insights into calculating Chi-square values, understanding hypothesis testing, and making informed decisions based on test outcomes.

Download Presentation

Please find below an Image/Link to download the presentation.
The content on the website is provided AS IS for your information and personal use only. It may not be sold, licensed, or shared on other websites without obtaining consent from the author. Download presentation by click this link. If you encounter any issues during the download, it is possible that the publisher has removed the file from their server.
E N D
Presentation Transcript
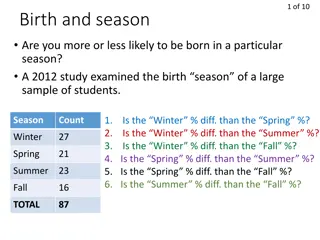
Chi-square goodness of fit Core issue in statistics: When are you viewing just random noise and when is there a real trend?
Chi-square goodness of fit Core issue in statistics: When are you viewing just random noise and when is there a real trend?
Chi-square goodness of fit Core issue in statistics: When are you viewing just random noise and when is there a real trend?
Chi-square goodness of fit Core issue in statistics: When are you viewing just random noise and when is there a real trend?
When to use a chi-square test Your response variable is count data Your response falls into different categories You have a hypothesis for the responses you expect You want to know if the difference between the responses you observe and the responses you expect is significant or not
How to interpret a chi-square test If the test tells you your data is not significantly different from what you expect, you support the hypothesis If the test tells you your data is significantly different from what you expect, you reject the hypothesis No statistical test ever proves a hypothesis.
What is chi-square? x2 = Chi-square value = Sum of x2= (Observed Value Expected Value)2 Expected Value Observed Expected Obs-Exp (Obs-Exp)2(Obs-Exp)2 Exp Category 1 Category 2 .. X2 total Degrees of Freedom
Chi-square probability table 0.99 0.95 0.9 0.8 0.7 0.6 0.5 0.4 0.3 0.2 0.1 0.05 0.01 df 1 0.0001 0.003 0.015 0.064 0.148 0.275 0.455 0.708 1.07 1.64 2.71 3.84 6.63 2 0.020 0.103 0.211 0.446 0.713 1.02 1.39 1.83 2.41 3.22 4.61 5.99 9.21 3 0.115 0.352 0.584 1.00 1.42 1.87 2.37 2.95 3.67 4.64 6.25 7.81 11.3 4 0.297 0.711 1.06 1.65 2.19 2.75 3.36 4.04 4.88 5.99 7.78 9.49 13.3 5 0.554 1.15 1.61 2.34 3.00 3.66 4.35 5.13 6.06 7.29 9.24 11.1 15.1 6 0.872 1.64 2.20 3.07 3.83 4.57 5.35 6.21 7.23 8.56 10.6 12.6 16.8 7 1.24 2.17 2.83 3.82 4.67 5.49 6.35 7.28 8.38 9.80 12.0 14.1 18.5 8 1.65 2.73 3.49 4.59 5.53 6.42 7.34 8.35 9.52 11.0 13.4 15.5 20.1
Chi-square probability table 0.95 Only 5% chance that the difference between your obs and exp values comes from chance alone 0.99 0.9 0.8 0.7 0.6 0.5 0.4 0.3 0.2 0.1 0.05 0.01 df 1 0.0001 0.003 0.015 0.064 0.148 0.275 0.455 0.708 1.07 1.64 2.71 3.84 6.63 2 0.020 0.103 0.211 0.446 0.713 Your hypothesis can be rejected 1.02 1.39 1.83 2.41 3.22 4.61 5.99 9.21 3 0.115 0.352 0.584 1.00 1.42 1.87 2.37 2.95 3.67 4.64 6.25 7.81 11.3 4 0.297 0.711 1.06 1.65 2.19 2.75 3.36 4.04 4.88 5.99 7.78 9.49 13.3 5 0.554 1.15 1.61 2.34 3.00 3.66 4.35 5.13 6.06 7.29 9.24 11.1 15.1 6 0.872 1.64 2.20 3.07 3.83 4.57 5.35 6.21 7.23 8.56 10.6 12.6 16.8 7 1.24 2.17 2.83 3.82 4.67 5.49 6.35 7.28 8.38 9.80 12.0 14.1 18.5 8 1.65 2.73 3.49 4.59 5.53 6.42 7.34 8.35 9.52 11.0 13.4 15.5 20.1
Chi-square probability table 50-60% chance differences are from random chance 0.99 0.95 0.9 0.8 0.7 0.6 0.5 0.4 0.3 0.2 0.1 0.05 0.01 df 1 0.0001 0.003 0.015 0.064 0.148 0.275 0.455 0.708 1.07 1.64 2.71 3.84 6.63 2 0.020 0.103 0.211 0.446 0.713 1.02 1.39 1.83 2.41 3.22 4.61 5.99 9.21 3 0.115 0.352 0.584 1.00 1.42 1.87 2.37 2.95 3.67 4.64 6.25 7.81 11.3 4 0.297 0.711 1.06 1.65 2.19 2.75 3.36 4.04 4.88 5.99 7.78 9.49 13.3 5 0.554 1.15 1.61 2.34 3.00 3.66 4.35 5.13 6.06 7.29 9.24 11.1 15.1 6 0.872 1.64 2.20 3.07 3.83 4.57 5.35 6.21 7.23 8.56 10.6 12.6 16.8 7 1.24 2.17 2.83 3.82 4.67 5.49 6.35 7.28 8.38 9.80 12.0 14.1 18.5 8 1.65 2.73 3.49 4.59 5.53 6.42 7.34 8.35 9.52 11.0 13.4 15.5 20.1
Bird song: Its not just for males anymore Male house wrens sing to attract mates and defend territories Females sing a lot too! Why?
Why do females sing? H1: To help coordinate their behavior with their male Prediction
Why do females sing? H2: To solicit copulations from the male Prediction
Why do females sing? H3: To defend their nests against other house wrens Prediction
Why do females sing? Null hypothesis: Female song occurs randomly Prediction