Understanding Chi-Square Formula Applications in Statistical Analysis

Chi-square distribution is utilized when dealing with collections of values requiring the addition of squared quantities. The Chi-square formula helps analyze data across categories to determine if the distribution varies significantly from chance. Through examples and interpretations of P-values, this tool aids in hypothesis testing, with common applications in biology, statistics, and medical literature. Explore how Chi-square tests provide insights into associations and correlations in diverse datasets.

Download Presentation

Please find below an Image/Link to download the presentation.
The content on the website is provided AS IS for your information and personal use only. It may not be sold, licensed, or shared on other websites without obtaining consent from the author. Download presentation by click this link. If you encounter any issues during the download, it is possible that the publisher has removed the file from their server.
E N D
Presentation Transcript
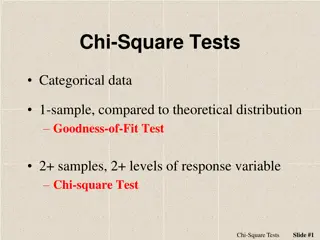
Chi Square (2)Test Chi-square distribution is encountered when we deal with collection of values that involve adding up square. Variances of samples require us to add a collection of squared quantities and thus have distributions that are related to chi-square distribution. The chi-square formula is used in data that consist of variables distributed across various categories and helps us to know whether that distribution is different from what one would expect by chance. Chi-square formula is used to compare two or more statistical data sets.
Chi square Example Group 1 Group 2 Student 40 30 Example: You research two groups of women and put them in categories of student, employed or self- employed. The numbers collected are different, but you now want to know Is that just a random occurrence? Or Is there any correlation? Employed 89 67 Self- employed 3 7
Chi Square Formula The Chi-Square is denoted by 2. The chi-square formula is: 2= (Oi Ei)2/Ei where, Oi= observed value (actual value) Ei= expected value.
Chi Square formula The Chi-Square test gives a P-value to help you know the correlation if any! Hypothesis Interpretation P-value Description A hypothesis is in consideration, that a given condition or statement might be true, which we can test later. For example It indicates the null hypothesis is very unlikely. P-value 0.05 Rejected A very small Chi-Square test statistic indicates that the collected data matches the expected data extremely well. It indicates the null hypothesis is very likely. Accepted or it fails to reject . P-value > 0.05 A very large Chi-Square test statistic indicates that the data does not match very well. If the chi-square value is large, the null hypothesis is rejected. The P-value is near the cut-off. It is considered as marginal The hypothesis needs more attention. P-value > 0.05
Given below are a few most common applications of the chi-square formula Used by Biologists to determine if there is a significant association between the two variables, such as the association between two species in a community. Used in various statistical procedures to help to decide if to hold onto or reject the hypothesis. Used in the medical literature to compare the incidence of the same characteristics in two or more groups. Applications of Chi Square Formula
Chi Square questions. Number of cars Oi Ei One car 30 25.6 Two cars 14 15 Three cars 6 5.2 Total 50
Chi Square Test Solution (Oi Ei)2 (Oi Ei)2/Ei Oi Ei One car 30 25.6 19.36 0.645 Two cars 14 15.1 1.21 0.086 Three cars 6 5.2 0.64 0.106 Total 50 0.837
Test")