Understanding Chi-Square Test in Statistics

www.kent.ac.uk/student-learning-advisory-service
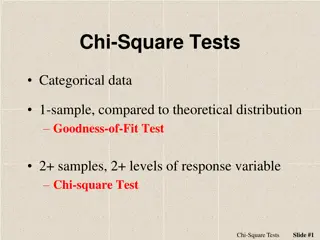
Chi-square Test
1
Chi-square Test
•
We will introduce chi square test, in particular we
will cover:
•
What a chi square test is
•
Chi square test in SPSS
•
This presentation is intended for students in initial
stages of Statistics. No previous knowledge is
required.
2
Chi-square Test
•
A non-parametric test that is used to measure the
association between two categorical variables.
•
We use it when we have observed frequencies of a
categorial variable (e.g., male vs female, healthy vs
sick).
3
Chi-square Test
There are 2 types of chi-square tests:
•
The
chi-square goodness of fit test
is used to
compare the observed frequencies in a data sample
with the frequencies based on some prior
expectation – either empirical or theoretical.
•
The
chi-square test of independence
assesses
whether observed frequencies are dependent on
(i.e., contingent on) certain conditions.
4
C
h
i
-
s
q
u
a
r
e
f
r
e
q
u
e
n
c
y
t
a
b
l
e
s
5
•
A frequency distribution table / contingency table shows how
observations are distributed between different groups (i.e., the
number of observations in each group).
A
chi-square goodness of fit test
can test
whether these observed frequencies are
significantly different from what was
expected, such as equal frequencies.
•
Null hypothesis (
H
0
):
The bird species
visit the feeder in the
same
proportions as the average over the
past five years.
•
Alternative hypothesis (
H
1
):
The bird
species visit the feeder in
different
proportions from the average over the
past five years.
https://www.scribbr.com/statistics/chi-square-tests/
C
h
i
-
s
q
u
a
r
e
f
r
e
q
u
e
n
c
y
t
a
b
l
e
s
6
•
A frequency distribution table / contingency table shows how
observations are distributed between different groups (i.e., the
number of observations in each group).
A
chi-square test of independence
can
test whether these observed frequencies
are significantly different from the
frequencies expected if handedness is
unrelated to nationality.
•
Null hypothesis (
H
0
):
The proportion of
people who are left-handed is
the
same
for Americans and Canadians.
•
Alternative hypothesis (
H
1
):
The
proportion of people who are left-
handed
differs
between nationalities.
https://www.scribbr.com/statistics/chi-square-tests/
A
s
s
u
m
p
t
i
o
n
s
o
f
t
h
e
C
h
i
-
s
q
u
a
r
e
Since we only require that the two variables are
categorical, there are no assumptions required on
the variables in the Chi-Square test.
7
T
h
e
X
2
s
t
a
t
i
s
t
i
c
8
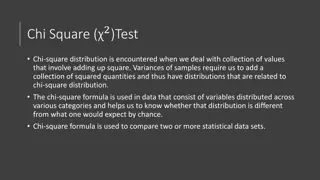
Both of Pearson’s chi-square tests use the same formula to
calculate the chi-square (X
2
) statistic:
Where:
•
X
2
is the chi-square statistic
•
Σ
is the summation operator (i.e., it
“takes the sum of”)
•
O
is the observed frequency
•
E
is the expected frequency
The larger the difference between the observations and
expectations (
O
–
E
in the equation), the bigger the chi-square
statistic will be.
The chi-square statistic gets compared with a critical value using
a chi-square critical value table or statistical software.
https://www.scribbr.com/statistics/chi-square-tests/
C
h
i
-
s
q
u
a
r
e
t
e
s
t
o
f
I
n
d
e
p
e
n
d
e
n
c
e
i
n
S
P
S
S
9
1.
Go to:
http://www.discoveringstatistics.com/docs/ds_d
ata_files/SPSS%20Data%20Files/
2.
Download the
Cats.sav
file
Then follow along!
To do this, you will need to install
SPSS:
https://www.kent.ac.uk/software/spss
-statistics
U
p
c
o
m
i
n
g
w
o
r
k
s
h
o
p
s
…
10
www.kent.ac.uk/student-learning-advisory-
service
m
a
t
h
s
/
s
t
a
t
s
a
p
p
o
i
n
t
m
e
n
t
s
a
v
a
i
l
a
b
l
e
!
Chi-square test is a non-parametric test used to measure the association between categorical variables. It can assess goodness of fit and test for independence between observed and expected frequencies. No specific assumptions are needed for the variables in this test. Chi-square frequency tables help analyze how observations are distributed among different groups, aiding in hypothesis testing related to proportions in populations.

Download Presentation

Please find below an Image/Link to download the presentation.
The content on the website is provided AS IS for your information and personal use only. It may not be sold, licensed, or shared on other websites without obtaining consent from the author. Download presentation by click this link. If you encounter any issues during the download, it is possible that the publisher has removed the file from their server.
E N D
Presentation Transcript
Chi-square Test www.kent.ac.uk/student-learning-advisory-service 1
Chi-square Test We will introduce chi square test, in particular we will cover: What a chi square test is Chi square test in SPSS This presentation is intended for students in initial stages of Statistics. No previous knowledge is required. 2
Chi-square Test A non-parametric test that is used to measure the association between two categorical variables. We use it when we have observed frequencies of a categorial variable (e.g., male vs female, healthy vs sick). 3
Chi-square Test There are 2 types of chi-square tests: The chi-square goodness of fit test is used to compare the observed frequencies in a data sample with the frequencies based on some prior expectation either empirical or theoretical. The chi-square test of independence assesses whether observed frequencies are dependent on (i.e., contingent on) certain conditions. 4
Chi Chi- -square frequency tables square frequency tables A frequency distribution table / contingency table shows how observations are distributed between different groups (i.e., the number of observations in each group). A chi-square goodness of fit test can test whether these observed frequencies are significantly different from what was expected, such as equal frequencies. Null hypothesis (H0): The bird species visit the feeder in the same proportions as the average over the past five years. Alternative hypothesis (H1): The bird species visit the feeder in different proportions from the average over the past five years. 5 https://www.scribbr.com/statistics/chi-square-tests/
Chi Chi- -square frequency tables square frequency tables A frequency distribution table / contingency table shows how observations are distributed between different groups (i.e., the number of observations in each group). A chi-square test of independence can test whether these observed frequencies are significantly different from the frequencies expected if handedness is unrelated to nationality. Null hypothesis (H0): The proportion of people who are left-handed is the same for Americans and Canadians. Alternative hypothesis (H1): The proportion of people who are left- handed differs between nationalities. 6 https://www.scribbr.com/statistics/chi-square-tests/
Assumptions of the Chi Assumptions of the Chi- -square square Since we only require that the two variables are categorical, there are no assumptions required on the variables in the Chi-Square test. 7
The X The X2 2 statistic statistic Both of Pearson s chi-square tests use the same formula to calculate the chi-square (X2) statistic: Where: X2 is the chi-square statistic is the summation operator (i.e., it takes the sum of ) O is the observed frequency E is the expected frequency The larger the difference between the observations and expectations (O E in the equation), the bigger the chi-square statistic will be. The chi-square statistic gets compared with a critical value using a chi-square critical value table or statistical software. 8 https://www.scribbr.com/statistics/chi-square-tests/
Chi Chi- -square test of Independence in square test of Independence in SPSS SPSS 1. Go to: http://www.discoveringstatistics.com/docs/ds_d ata_files/SPSS%20Data%20Files/ 2. Download the Cats.sav file Then follow along! To do this, you will need to install SPSS: https://www.kent.ac.uk/software/spss -statistics 9
Upcoming workshops Upcoming workshops www.kent.ac.uk/student-learning-advisory- service maths/stats appointments available! maths/stats appointments available! 10