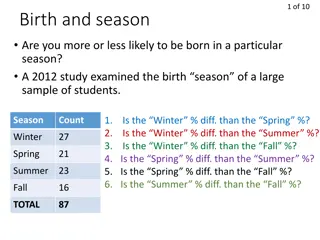
Understanding Chi-Square Test for Goodness of Fit

Chi-square test is a statistical method used to assess how well observed data match the predicted values from a hypothesis. It does not confirm the hypothesis but measures the extent of fit between data and the hypothesis. This test is crucial for determining the significance of differences between expected and observed data, helping in hypothesis evaluation. The process involves calculating observed and expected values, applying the chi-square formula, assessing degrees of freedom, and comparing critical values. An example involving pea plant genotypes illustrates how this test can be used in genetics to analyze offspring ratios.

Download Presentation

Please find below an Image/Link to download the presentation.
The content on the website is provided AS IS for your information and personal use only. It may not be sold, licensed, or shared on other websites without obtaining consent from the author. Download presentation by click this link. If you encounter any issues during the download, it is possible that the publisher has removed the file from their server.
E N D
Presentation Transcript
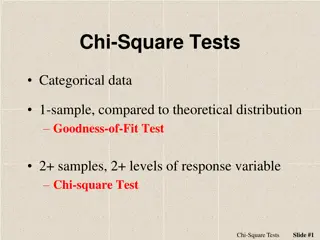
Chi Square Test A statistical method used to determine goodness of fit Goodness of Fit: how close the observed data are to those predicted from a hypothesis It does not prove that a hypothesis is correct It evaluates to what extent the data and the hypothesis have a good fit how great a variance is significant?
Chi Square Test Formula o = observed data in each category e = observed data in each category based on the experimenter s hypothesis = Sum of the calculations for each category (o e)2 e 2 =
Chi Square Test Null Hypothesis: hypothesis that states there will be no difference between expected and observed data You wonder if musicians have faster reaction times than athletes Null Hypothesis there is no difference between the two Of 100 offspring, there will be a ratio of dominant (red) to recessive (white)
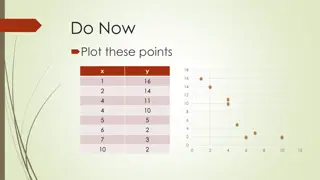
Suppose a cross between two pea plants yields a population of 880 plants, 639 with green seeds and 241 with yellow seeds. You are asked to propose the genotypes of the parents. Your hypothesis is that the allele for green is dominant to yellow and both parents are heterozygous. If your hypothesis is true, then the predicted ratio of offspring from the cross would be 3:1 as predicted from the results of a Punnett square. Is it?
Chi Square Test Example: Observed Frequency Expected* Frequency (o) (e) red flowers white flowers 73 75 27 25 *The expected frequency depends upon the hypothesis.
Chi Square Test (o - e )2 o e (o - e)2 e red flowers white flowers 2 = -2 4 4 0.053 0.16 2 (o e)2 e = 0.053 + 0.16 = 0.213 Divide by 4/75 for RED = 0.053 and 4/ 25 for white= 0.16 add together for total population= 0.213
Chi Square Test Degrees of Freedom: critical factor in chi square, essentially the number of independent random variables involved. Degrees of freedom is simply the number of classes of offspring minus 1 (d.f. = n-1). For our example, there are 2 classes of offspring: red and white. Thus, degrees of freedom (d.f.) = 2 -1 = 1.
Chi Square Test Critical values for chi-square are found on tables, sorted by degrees of freedom and probability levels. A p-value gives us the probability that the null hypothesis (expected=observed) is correct. Always use p = 0.05.
Your value Chi Square Test 2 = 0.213 Do you accept or reject the null hypothesis?
Chi Square Test If chi-square value is greater than the critical value from the table, reject the null hypothesis. If chi-square value is less than the critical value, you fail to reject the null hypothesis (that is, you accept that your genetic theory about the expected ratio is correct).