Understanding Chi-Square Analysis: Types, Examples, and Reporting

Chi-Square analysis determines if there is a difference between observed and expected frequencies, commonly used for assessing goodness of fit and independence. Learn about the types of Chi-Square tests, how to conduct analysis using SPSS software, and where to find practice data. Dive into the details of Chi-Square analysis step by step for efficient reporting and interpretation.

Download Presentation

Please find below an Image/Link to download the presentation.
The content on the website is provided AS IS for your information and personal use only. It may not be sold, licensed, or shared on other websites without obtaining consent from the author. Download presentation by click this link. If you encounter any issues during the download, it is possible that the publisher has removed the file from their server.
E N D
Presentation Transcript
CONTENTS CONTENTS 1. What is a Chi-Square? 2. Types of Chi-Square Tests 3. A worked example on SPSS 4. Reporting
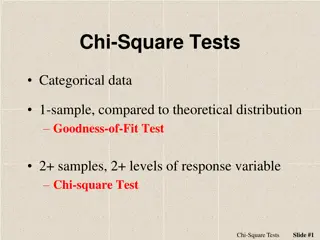
Types of Chi Types of Chi- -Square Tests Square Tests Goodness of Goodness of Fit Fit Test of Test of Independence Independence To assess if observed membership in a group is different from expected membership Used commonly to evaluate if two nominal variables are related
More background info More background info In a Chi-Square analysis, we are assessing if there is a difference between an observed frequency and an expected frequency If students had no preference for any type of coke, we would expect to see roughly an equal number of 25 students in both observed and expected cells for each flavour
More background info More background info The observed frequency will come from the actual choices that the 100 students made We then compare the observed and expected frequencies if this happens by chance?
Location of SPSS Data Files Location of SPSS Data Files Example SPSS data for practice are available on LearnJCU LearnJCU: Log in to LearnJCU -> Organisations -> Learning Centre JCU Singapore -> Learning Centre -> Statistics and Maths -> SPSS Data for Practice
Now onto SPSS Now onto SPSS Before we run the analysis data, we will need to carry out an additional step: Click on Data -> Weight Cases
Now onto SPSS Now onto SPSS Select Weight cases by, and bring the variable Frequency over to the right Click OK, we can now run the goodness of fit analysis
Now onto SPSS Now onto SPSS To run a Goodness of Fit test: Click on Analyze -> Nonparametric Tests -> LegacyDialogs -> Chi-square
Now onto SPSS Now onto SPSS Select TypeOfCoke and move it to under the Test Variable List We can leave all other options as the default Click OK!
Now onto SPSS Now onto SPSS Observed N shows the number of cases we observed for each type of coke df is calculated as n - 1 (number of coke options minus 1) = 3 Expected N shows the number of cases we would expect if students had no specific preference With alpha value set at .05, we obtained a p value of less than .001. This means that there is a significant difference in the types of coke student preferred We obtained a Chi- Square statistic of 60.240
Writing up the results Writing up the results An example write-up can be found on page 263 in Allen, P., Bennett, K., & Heritage, B. (2019). SPSS Statistics: A Practical Guide (4th ed.). Cengage Learning.
Now onto SPSS Now onto SPSS To conduct a test of independence: Click on Analyze -> Descriptive Statistics -> Crosstabs
Now onto SPSS Now onto SPSS Shift TypeofCoke over to under Row(s), and Weight to under Column(s) Click on Statisticsto tweak some settings
Now onto SPSS Now onto SPSS Select Chi-square You can also select Phi and Cramer s V to obtain effect size Click Continue
Now onto SPSS Now onto SPSS Next, click on Cells Select Observed and Expected This will provide us with descriptive statistics that we can use in our write- up Click Continue, and OK!
Now onto SPSS Now onto SPSS This table shows the breakdown of observed and expected counts across all levels of our 2 variables This is the p value; it is larger than the alpha value of .05. We can conclude that students weight and their preferred types of coke were not related Pearson s Chi-Square value = 10.157, with a df of 6
Writing up the results Writing up the results An example write-up can be found on: JCUS Learning Centre website -> Statistics and Mathematics Support
Any questions? Any questions? learningcentre-singapore@jcu.edu.au