Understanding Chi-Square Tests in Statistics

Chi-square tests in statistics are used to examine the relationship between categorical variables or test claims about categorical variable distributions in populations. The Chi-square test statistic measures the discrepancy between observed and expected counts, with the Chi-square distribution helping determine significance. Validity of chi-square tests depends on random sampling and expected counts over 5. Sample size affects the P-value, influencing conclusions drawn from the test.

Download Presentation

Please find below an Image/Link to download the presentation.
The content on the website is provided AS IS for your information and personal use only. It may not be sold, licensed, or shared on other websites without obtaining consent from the author. Download presentation by click this link. If you encounter any issues during the download, it is possible that the publisher has removed the file from their server.
E N D
Presentation Transcript
Chi-Square Tests Concepts in Statistics
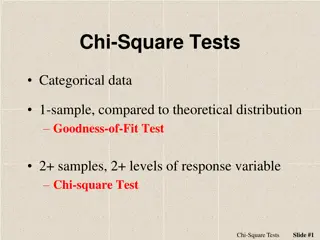
Hypothesis Tests that the Chi-Square Test Statistic can Address: Goodness-of-Fit Test: Test a claim about the distribution of a categorical variable in a population. The distribution of blood types for whites in the US is 45% type O, 41% type A, 10% type B, and 4% type AB. Is the distribution of blood types different for Asian Americans? Test of Independence: Test a claim about the relationship between two categorical variables in a population. For young adults in the US, is gender related to body image? Test of Homogeneity: Test a claim about the distribution of a categorical variable in several populations. Does the use of steroids in collegiate athletics differ across the three NCAA divisions?
Chi-Square Test observed expected2 expected ?2= The chi-square test statistic 2measures how far the observed data are from the null hypothesis by comparing observed counts and expected counts. Expected counts are the counts we expect to see if the null hypothesis is true.
The Chi-Square Test Statistic and Distribution The chi-square model is a family of curves that depend on degrees of freedom. For a one-way table the degrees of freedom equals (? 1). All chi-square curves are skewed to the right with a mean equal to the degrees of freedom. A chi-square model is a good fit for the distribution of the chi-square test statistic only if the following conditions are met: The sample is randomly selected. All expected counts are 5 or greater. If these conditions are met, we use the chi-square distribution to find the P- value.
The Chi-Square Test Statistic and Distribution (cont.) If the P-value is at least as small as the significance level, we reject the null hypothesis and accept the alternative hypothesis. The P-value is the likelihood that results from random samples have a 2value equal to or greater than that calculated from the data if the null hypothesis is true. For different degrees of freedom, the same 2value gives different P-values.
Effect of Sample Size on Chi-Square: Roadside Survey Sample size can affect the P-value and our conclusion. This is true for chi- square. In this example, all of the counts of the roadside survey were multiplied by 3. Technology was used to find expected counts and the chi-square statistic. The increase in the chi-square value gives a statistically significant P- value of 0.0267
Goodness-of-Fit test for a One-Way Table Consider one population and one categorical variable. Expands the z-test for a population proportion learned in Inference for One Proportion by looking at the distribution of proportions for all categories defined by the categorical variable. Determines whether a set of categorical data comes from a claimed distribution. The null hypothesis is that the proportion in each category in the population has a specific distribution. The alternative hypothesis says that the proportions in the population are not distributed as stated in the null hypothesis. To test the hypotheses, select a random sample from the population and gather data for one categorical variable.
Test of Independence for a Two-Way Table Consider one population and two categorical variables. In Probability and Probability Distribution, we learned that two events are independent if ? ? ? = ? ? , but we did not pay attention to variability in the sample. With the chi-square test of independence, we have a method for deciding whether our observed ? ? ? is too far from our observed ? ? to infer independence in the population. The null hypothesis says the two variables are independent. The alternative hypothesis says the two variables are dependent. To test our hypotheses, select a single random sample and gather data for two different categorical variables.
Test of Homogeneity Consider two or more populations (or two or more subgroups of a population) and a single categorical variable. Expands on the test for a difference in two population proportions learned in Inference for Two Proportions by comparing the distribution of the categorical variable across multiple groups or populations. The null hypothesis says that the distribution of proportions for all categories is the same in each group or population. The alternative hypothesis says that the distributions differ. To test our hypotheses, select a random sample from each population or subgroup independently. Gather data for one categorical variable.
Example: Steroid Use in Collegiate Sports Hypotheses H0: For each of the three NCAA divisions, the distribution of yes and no responses to the question about steroid use is the same. Ha: The distribution of responses is not the same. Data The data is summarized in a two-way table.
Example: Steroid Use in Collegiate Sports (cont. 1) Data Use percentages to compare the distributions of yes and no responses in the three samples. This step is similar to data analysis for the test of independence.
Example: Steroid Use in Collegiate Sports (cont. 2) Assess the evidence Calculating expected values for a test of homogeneity
Example: Steroid Use in Collegiate Sports (cont. 3) Assess the evidence Checking conditions A sample is randomly selected from each population All of the expected counts are 5 or greater Since this data meets the conditions, proceed with calculating the 2 test statistic.
Example: Steroid Use in Collegiate Sports (cont. 4) Assess the evidence Finding degrees of freedom and the P-Value Conclusion The data does not provide strong enough evidence to conclude that steroid use differs in the three NCAA divisions (P-value = 0.4561).
Quick Review What are 3 different hypothesis tests that are used with the chi-square test statistic? What type of research question could be answered with a chi-square goodness-of-fit test? What is the chi-square test formula? What conditions need to be met to use the chi-square distribution to find the P-value? What is considered in the test of independence? What does the test of homogeneity test a claim about?


")


")
")
")
")