Understanding Chi-Square and F-Distributions in Statistics

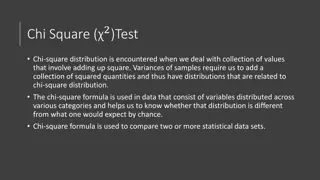
Diving into the world of statistical distributions, this content explores the chi-square distribution and its relationship with the normal distribution. It delves into how the chi-square distribution is related to the sampling distribution of variance, examines the F-distribution, and explains key concepts such as degrees of freedom and expected values. Visual aids and examples help in understanding the theoretical foundations of these distributions and their practical applications in analyzing data variability.

Download Presentation

Please find below an Image/Link to download the presentation.
The content on the website is provided AS IS for your information and personal use only. It may not be sold, licensed, or shared on other websites without obtaining consent from the author. Download presentation by click this link. If you encounter any issues during the download, it is possible that the publisher has removed the file from their server.
E N D
Presentation Transcript
Chi-square and F Distributions Children of the Normal
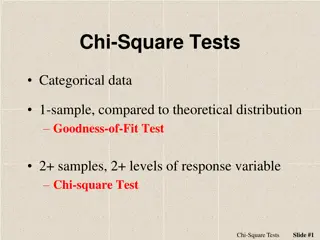
Questions What is the chi-square distribution? How is it related to the Normal? How is the chi-square distribution related to the sampling distribution of the variance? Test a population value of the variance; put confidence intervals around a population value.
Questions How is the F distribution related the Normal? To Chi-square?
Distributions There are many theoretical distributions, both continuous and discrete. Howell calls these test statistics We use 4 test statistics a lot: z (unit normal), t, chi-square ( ), and F. Z and t are closely related to the sampling distribution of means; chi- square and F are closely related to the sampling distribution of variances. 2
Chi-square Distribution (1) ) ( ) ( X X X z score = = ; z z SD 2 ( ) X = 2 z score squared z 2 = 2 2 z Make it Greek ) 1 ( What would its sampling distribution look like? Minimum value is zero. Maximum value is infinite. Most values are between zero and 1; most around zero.
Chi-square (2) What if we took 2 values of z2 at random and added them? 2 2 ( ) ( ) X X 2 2 ( ) ( ) X X = = 2 1 2 2 ; 1 2 z z = + = + 2 ) 2 ( 2 1 2 2 1 2 z z 2 2 2 2 Same minimum and maximum as before, but now average should be a bit bigger. Chi-square is the distribution of a sum of squares. Each squared deviation is taken from the unit normal: N(0,1). The shape of the chi-square distribution depends on the number of squared deviates that are added together.
Chi-square 3 The distribution of chi-square depends on 1 parameter, its degrees of freedom (df or v). As df gets large, curve is less skewed, more normal.
Chi-square (4) The expected value of chi-square is df. The mean of the chi-square distribution is its degrees of freedom. The expected variance of the distribution is 2df. If the variance is 2df, the standard deviation must be sqrt(2df). There are tables of chi-square so you can find 5 or 1 percent of the distribution. Chi-square is additive. = + 2 ( 2 ( 2 ( + ) ) ) v v v v 1 2 1 2
Distribution of Sample Variance = Sample estimate of population variance (unbiased). 2 ( N ) y y 2 s 1 Multiply variance estimate by N-1 to get sum of squares. Divide by population variance to stadnardize. Result is a random variable distributed as chi-square with (N-1) df. ) 1 2 ( N s = 2 ( ) 1 N 2 We can use info about the sampling distribution of the variance estimate to find confidence intervals and conduct statistical tests.
Testing Exact Hypotheses about a Variance = H Test the null that the population variance has some specific value. Pick alpha and rejection region. Then: = variance and sample variance into equation along with sample size we used to estimate variance. Compare to chi-square distribution. 2 2 0 0: 2 Plug hypothesized population ( ) 1 N s 2 ( ) 1 N 2 0
Example of Exact Test Test about variance of height of people in inches. Grab 30 people at random and measure height. H H Note: 1 tailed test on small side. Set alpha=.01. Mean is 29, so it s on the small side. But for Q=.99, the value of chi-square is 14.257. Cannot reject null. 2 2 : . 6 25 = ; : . 6 25 . 0 1 = 2 30 ; . 4 55 N s ( 29 )( . 4 55 ) = = 2 29 21 11 . . 6 25 = s 2 2 : . 6 25 = ; : . 6 Note: 2 tailed with alpha=.01. 25 . H H 0 1 = 2 30 ; . 4 55 N Now chi-square with v=29 and Q=.995 is 13.121 and also with Q=.005 the result is 52.336. N. S. either way.
Confidence Intervals for the Variance 2 2s We use to estimate . It can be shown that: ) 1 ) 1 2 2 ( ( N s N s = 2 . 95 p 2 ( 2 ( 025 ;. 1 975 ;. 1 ) ) N N 2s Suppose N=15 and is 10. Then df=14 and for Q=.025 the value is 26.12. For Q=.975 the value is 5.63. )( 14 ( 12 . 26 24 36 . 5 p 14 ( )( 10 ) 10 ) = 2 95 . p . 5 63 = 2 87 . 95 .
Normality Assumption We assume normal distributions to figure sampling distributions and thus p levels. Violations of normality have minor implications for testing means, especially as N gets large. Violations of normality are more serious for testing variances. Look at your data before conducting this test. Can test for normality.
R functions for chi-square M(chisq) = df (expected value) SD(chisq) = 2df (expected value) qchisq(.95, df=7) = 14.07 qchisq(.99, df=7) = 18.48 pchisq(7, df=7) = .57 pchisq(100, df=100) = .52 rchisq(4, df=3) [1] 0.6 2.3 2.9 1.2
Review You have sample 25 children from an elementary school 5th grade class and measured the height of each. You wonder whether these children are more variable in height than typical children. Their variance in height is 4. Compute a confidence interval for this variance. If the variance of height in children in 5th grade nationally is 2, do you consider this sample ordinary?
The F Distribution (1) The F distribution is the ratio of two variance estimates: 2 1 . est s . 2 1 s est = = F 2 2 2 2 Also the ratio of two chi-squares, each divided by its degrees of freedom: 2 ( / v In our applications, v2 will be larger than v1 and v2 will be larger than 2. In such a case, the mean of the F distribution (expected value) is v2 /(v2 -2). ) 1 v = F 1 2 ( / ) 2 v 2 v
F Distribution (2) F depends on two parameters: v1 and v2 (df1 and df2). The shape of F changes with these. Range is 0 to infinity. Shaped a bit like chi-square. F tables show critical values for df in the numerator and df in the denominator. F tables are 1-tailed; can figure 2-tailed if you need to (but you usually don t).
F table critical values Numerator df: dfB dfW 1 2 3 4 5 5 5% 1% 6.61 16.3 5.79 13.3 5.41 12.1 5.19 11.4 5.05 11.0 10 5% 1% 4.96 10.0 4.10 7.56 3.71 6.55 3.48 5.99 3.33 5.64 12 5% 1% 4.75 9.33 3.89 6.94 3.49 5.95 3.26 5.41 3.11 5.06 14 5% 1% 4.60 8.86 3.74 6.51 3.34 5.56 3.11 5.04 2.96 4.70 e.g. critical value of F at alpha=.05 with 3 & 12 df =3.49
Testing Hypotheses about 2 Variances Suppose Note 1-tailed. We find 2 1 2 2 2 1 2 2 : ; : H H 0 1 = ; 8 . 5 = = 7 . 1 = 2 1 2 2 16 ; 16 ; N s N s 1 2 Then df1=df2 = 15, and 8 . 5 2 2 2 1 s Going to the F table with 15 and 15 df, we find that for alpha = .05 (1-tailed), the critical value is 2.40. Therefore the result is significant. =s = = . 3 41 F 7 . 1 Hint: put the larger variance on the top. That way you are looking at the right tail.
R code F distribution qf(.95, df1=3, df2=12) = 3.49 qf(.99, df1=3, df2=12) = 5.95 pf(15, df1=3, df2=12) = .9998 1-pf(15, df1=3, df2=12) = .0002
A Look Ahead The F distribution is used in many statistical tests Test for equality of variances. Tests for differences in means in ANOVA. Tests for regression models (models relating one continuous variable to another like SAT and GPA). R-square and R- square change or increment.
Relations among Distributions the Children of the Normal Chi-square is drawn from the normal. N(0,1) deviates squared and summed. F is the ratio of two chi-squares, each divided by its df. A chi-square divided by its df is a variance estimate, that is, a sum of squares divided by degrees of freedom. F = t2. If you square t, you get an F with 1 df in the numerator. F t = 2 ( ) , 1 ( ) v v
Review How is F related to the Normal? To chi-square? Suppose we have 2 samples and we want to know whether they were drawn from populations where the variances are equal. Sample1: N=50, s2=25; Sample 2: N=60, s2=30. How can we test? What is the best conclusion for these data?


")
")

")


")
")