Understanding Pie Charts for Frequency Diagrams
Learn how to accurately interpret and adjust pie charts for frequency diagrams, determine fractions and angles, calculate ratios, and analyze survey data. Practical examples with clear instructions provided to enhance comprehension.

Download Presentation

Please find below an Image/Link to download the presentation.
The content on the website is provided AS IS for your information and personal use only. It may not be sold, licensed, or shared on other websites without obtaining consent from the author. Download presentation by click this link. If you encounter any issues during the download, it is possible that the publisher has removed the file from their server.
E N D
Presentation Transcript
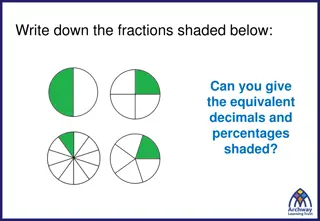
On each of the following slides there will be a frequency diagram. For each one, you must move your pie chart so that it shows the information on the frequency diagram as accurately as possible.
9 8 7 6 5 4 3 2 1 0 What fraction of the whole circle is each sector in your pie chart? What angle is each sector in your pie chart. What is the ratio of red to blue? How many people were asked in this survey? How is the number of people asked shown on your pie chart?
9 8 7 6 5 4 3 2 1 0 What fraction of the circle will the blue sector be in your pie chart? What angle will that be? What is the ratio of blue to red?
10 9 8 7 6 5 4 3 2 1 0 What is the ratio of red to blue to yellow? What is the fraction is the blue sector in your pie chart? What angle would this be?
10 9 8 7 6 5 4 3 2 1 0 What fraction of your pie chart is yellow? What percentage is this? What angle is your yellow sector? What fraction is your red sector?
100% 90% 80% 70% 60% 50% 40% 30% 20% 10% 0% Roughly what percentage of the sample chose blue? If 60 people were surveyed, how many chose yellow? What angle represents red on your pie chart? How did you work it out?
How do I find the angles when the fractions are more difficult? Colour Frequency Blue 20 Red 10 Yellow 6 What fraction of your pie chart is blue? What fraction of your pie chart is red? What fraction of your pie chart is yellow?
What angle of the pie chart will represent red? Colour Frequency Fraction Blue 20 Red 10 Yellow 6 What is the multiplicand? 360 What is the multiplier? So the calculation is 360 10 36 The angle is 200
What angle of the pie chart will represent blue? Colour Frequency Fraction Blue 20 Red 10 Yellow 6 How did you work it out?
What angle of the pie chart will represent yellow? Colour Frequency Fraction Blue 20 Red 10 Yellow 6 How did you work it out?
What angle of the pie chart will represent yellow? Colour Frequency Fraction Blue 20 Red 10 Yellow 6 How can we draw this pie chart?
In your books Title: Drawing a pie chart from a frequency diagram 10 Colour Frequency 8 Red 6 Blue 4 2 Yellow 0 Copy the frequency diagram into your book. Copy and complete the table. Work out what fraction of the pie chart each colour would cover. Work out the angle for each colour and draw the pie chart.