The Joy of Sets: Graphical Alternatives to Euler and Venn Diagrams

Graphical representations of set membership can be effectively portrayed using alternatives to traditional Euler and Venn diagrams. Learn about upset plots, indicating set membership graphically, and the use of Venn or Euler diagrams as solutions. Explore the historical context and challenges with Venn diagrams, and discover graphical methods for visualizing complex subsets.

Download Presentation

Please find below an Image/Link to download the presentation.
The content on the website is provided AS IS for your information and personal use only. It may not be sold, licensed, or shared on other websites without obtaining consent from the author. Download presentation by click this link. If you encounter any issues during the download, it is possible that the publisher has removed the file from their server.
E N D
Presentation Transcript
The joy of sets: Graphical alternatives to Euler and Venn diagrams Nicholas J. Cox Department of Geography, Durham University Tim P. Morris MRC Clinical Trials Unit at UCL
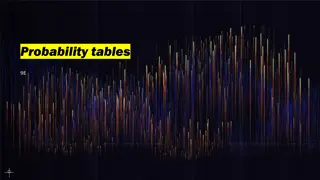
How this started and where we are During the previous meeting on 8 September 2022 TPM asked NJC for advice on how to draw so-called upsetplots. A year later we have four commands on SSC: upsetplot vennbar sortmean (a little deal; bundled with either of the above) jaccard (another little deal) A paper is intended for the Stata Journal. Here following is a sample graph from upsetplot to give some flavour. 2
The problem: indicating set membership graphically We have overlapping or intersecting sets. Data on membership of each set can be held in a bundle of indicator variables (1 if inside, 0 if outside the set). We want to show the frequencies of different subsets graphically. Counting is easy. The problem lies in the graphics. If the frequencies are already a separate variable in your dataset, that s fine. Examples are Missing value structure (1 if missing, 0 if not) Medical symptoms Social survey Gene families in genomes 4
The solution? Venn or Euler diagrams A common solution for a few sets is to annotate a Venn or Euler diagram. Community-contributed Stata programs exist from Jens M. Lauritsen, Wenfeng Gong and Jan Ostermann, and Mead Over. search venndiag search pvenn search pvenn2 but there is no official command! 5
Whats in a name? Euler deserves to be mentioned more often, and the history is even longer, but we will follow common usage and just mention Venn from now on. 9
Problems with the Venn solution Richard Hamming (The Art of Probability for Scientists and Engineers, 1991, pp.16 17) commended Venn diagrams for simple cases yet continued: But if you try to go to very many subsets then the problem of drawing a diagram which will show clearly what you are doing is often difficult. Circles are not, of course, necessary but when you are forced to draw very snake-like regions then the diagram is of little help in visualizing the situation. Robert Kosara (https://eagereyes.org/criticism/autism-diagnosis-accuracy, 2007) I would argue that Venn diagrams are a great tool for learning about sets, but useless as a visualization. 10
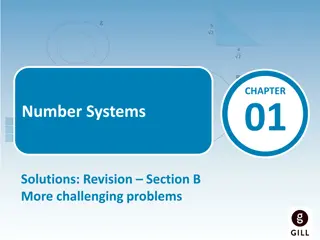
The banana genome, suitably represented? D'Hont, A. and many authors. 2012. The banana (Musa acuminata) genome and the evolution of monocotyledonous plants. Nature 488: 213-217. https://doi.org/10.1038/nature11241 But does it work well? In principle, all the data on frequencies are shown. In practice, only individual detail can be read off easily and effectively. 12
A combinatorial challenge for almost every solution Given k sets and their indicator variables, there are 2k possible subsets. Thus for k = 1, 2, , 5, , 10, that means 2, 4, , 32, , 1024, possible subsets. We could code these by binary numbers, such as 00, 01, 10, 11 for k = 2. The subset that is binary number zero may or may not occur in the data. sometimes it does: patients with no symptoms sometimes it doesn t: gene families that occur in no genomes in the study 13
What may help Many possible subsets may not occur in practice. What is more, the commands here allow selections of which subsets to show. 14
The great divide and its compensations As often with Stata graphics, there is a choice for the programmer between writing a wrapper for say graph bar or twoway bar. This is the main reason for the provision of two separate commands, upsetplot and vennbar. upsetplot is a wrapper for twoway bar and siblings. vennbar is a wrapper for graph hbar [NB] but could be recast by (e.g.) calling up graph dot. In each case options provide a great deal of flexibility. 15
Working with a reduced dataset Like many graphics commands, these commands do various calculations first and use a reduced dataset in plotting data. Unusually, the reduced dataset has variable names that are accessible to the user and that are used in any saved version. 16
Variables for each subset in reduced data _binary is string and contains a code such as "00", "01", "10" or "11". _decimal is numeric and contains a decimal equivalent such as 0, 1, 2 or 3. _text is string and contains a description using variable names or labels. _count is numeric and contains the count (more generally frequency). (Optionally) _percent is numeric and contains percent occurrence. _degree is numeric and indicates the number of participating sets. 17
Variables for each set in reduced data _set is string and indicates each set using its variable name or its variable label. _setfreq is numeric and indicates the frequency of each set. _set and _setfreq are physically but not logically aligned with the other variables. 18
upsetplot Names should not matter, but they often do. A good name can be evocative, encouraging, or even entertaining. A poor name can confuse or even condemn an idea to obscurity. The name upsetplot (or mutations using upper case) was a play on set. The original author, Alexander Lex, was upset by Venn-Euler diagrams. The term and the idea seem to have caught on widely within genomics. Whatever you think, note that the main idea was independently published by Antony Unwin in his book Graphical Data Analysis with R (2015). 19
Disclaimer Our Stata implementation does not claim to provide or support all the extra bells and whistles implemented elsewhere some of which seem likely only to complicate or confuse an already challenging design. Proclaimer In some detailed respects, our implementation may allow better plots than some others. 20
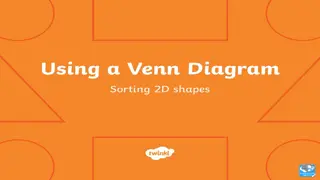
Data from Schnable, P.S. and many co-authors. 2009. The B73 maize genome: complexity, diversity, and dynamics. Science 326: 1112 1115. http://www.jstor.org/stable/27736489 The main twist on standard designs is the graphical legend in which a marker that is present denotes membership of a set. The options, some standard for twoway and others designed for purpose, allow flexibility, for example in sort order. The next three slides show variations in sort order. 22
Set information As mentioned earlier, information on frequency in each set can be saved and so plotted separately. For this example, a plot is of limited use, but that is not true generally. 26
Back to bananas For a more challenging example, we try our hand at the banana genome as compared with others. 26 = 64 possible subsets! Or 63. 28
Missing value structure Missing values for some variables in the dataset downloadable by webuse nlswork 30
vennbar For consistency this might have been called vennbarchart, but that was too tedious to type. More importantly, some flexibility comes free with use of graph hbar, such as good support for groupings from over() options. As in general, graph hbar is a good idea to ensure that text is always easy to read. But you can call up graph bar or graph dot if you prefer. 33
Going further Square root scale for subset frequencies? (cf. John W. Tukey s rootogram). All graphs use Stata scheme s1color, which is recommended as a lazy but good default. In Stata 18 upwards stcolor is an excellent alternative. In fact, the larger default xsize in stcolor is good for many upsetplots. The help files are very detailed, with complete code for all examples here, much advice and many references. 40
Cognate commands findname (Stata Journal) search findname groups (Stata Journal) search st0496, entry 41
This font is Georgia. This font is Lucida Console. 43