Understanding System Diagrams: An Overview

Visual representations play a crucial role in understanding complex systems. System diagrams and models provide a simplified view of reality for better comprehension, analysis, and communication among stakeholders. Explore the importance, types, and uses of system diagrams through various examples and insights.

Download Presentation

Please find below an Image/Link to download the presentation.
The content on the website is provided AS IS for your information and personal use only. It may not be sold, licensed, or shared on other websites without obtaining consent from the author. Download presentation by click this link. If you encounter any issues during the download, it is possible that the publisher has removed the file from their server.
E N D
Presentation Transcript
System Diagrams A VISUAL REPRESENTATION OF THE SYSTEM
Model A model is a description from which detail has been removed in a systematic manner and for a particular purpose A simplification of reality intended to promote understanding Models are the most important engineering tool, they allow us to understand and analyze large and complex problems https://www.cl.cam.ac.uk/teaching/1112/SWDesign/softwaredesign01.pdf
Robert Robert Spinrad Spinrad A good solution somehow looks nice 1991
System Diagram Abstract Description of the system whose requirements are being modeled Components of a System Diagram: Boundaries of the overall system Inputs to and outputs from the system Subsystems of the system Identification of the interfaces between the subsystems A System Diagram is a high-level model of the system.
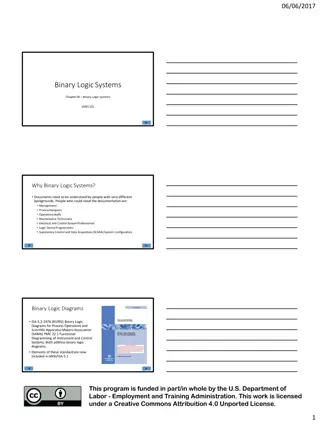
Why Create a System Diagram? To help explain the proposed requirements to other system stakeholders. To discuss design proposals with engineers and to document the system for implementation. To show the organization and architecture of the system.
Type of System Diagrams Choose the type of information you want to convey AND what questions you are trying to answer Big blocks APIs Physical assets Data or communications System Diagrams are variable in their view of the system A system diagram can show - Components - Interactions - Boundaries - Then select HOW you will show it Components & Interactions tend to be the most common
Toaster System Diagram: Inputs Outputs System Where s the WIFI connection? https://deseng.ryerson.ca/dokuwiki/_detail/design:toasterarchitecture.jpg?id=design%3Asystem_diagram
Unit of study as a context for prototyping Student Performance Learn (Students) Feedback for instruction & planning Student Profile Practice Plan (Teacher) Paths Evaluate (Teacher) Instruct (Teacher) Evidence Demo Content, Curriculum map Student Profile Alerts Goals and Interests SIS Unpack concepts Sequence Scaffold Model Assign Score Monitor Adjust Communicate Collaborate Teach interventions 1. Mastery 2. Growth 3. Portfolio a. Exemplar b. Parent/teacher c. APPR d. Issue tracking Practice (assignments, check-ins, formative assess) Demonstrate (summative, benchmark) Collaborate (teachers, peers) Reflect on student performance Student Performance Pre-assessment ELA summary Writing samples Paths Mastery visualization Student grouping Key messages Providing teachers a dynamic, holistic view of each student facilitates personalization day-to-day. Easy and timely access to the desired information is a key challenge. Understanding what teachers do with this information guides future development. 11
Amazon Buy Now Components of a System Diagram: Boundaries of the overall system Inputs to and outputs from the system Subsystems of the system Identification of the interfaces between the subsystems 12