National 5 Applications of Maths: Charts, Graphs, and Tables Examples
Explore various examples related to reading bar charts, line graphs, stem-and-leaf diagrams, pie charts, and constructing stem-and-leaf charts in the context of National 5 Applications of Maths. Practice interpreting data from tables, line graphs, and stem-and-leaf diagrams to enhance your understanding of mathematical concepts.

Download Presentation

Please find below an Image/Link to download the presentation.
The content on the website is provided AS IS for your information and personal use only. It may not be sold, licensed, or shared on other websites without obtaining consent from the author.If you encounter any issues during the download, it is possible that the publisher has removed the file from their server.
You are allowed to download the files provided on this website for personal or commercial use, subject to the condition that they are used lawfully. All files are the property of their respective owners.
The content on the website is provided AS IS for your information and personal use only. It may not be sold, licensed, or shared on other websites without obtaining consent from the author.
E N D
Presentation Transcript
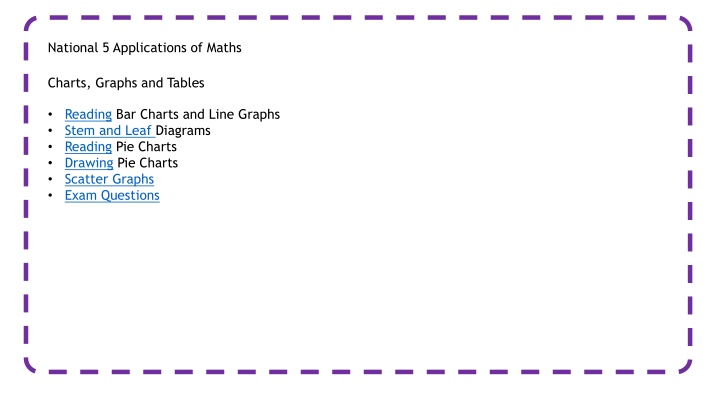
National 5 Applications of Maths Charts, Graphs and Tables Reading Bar Charts and Line Graphs Stem and Leaf Diagrams Reading Pie Charts Drawing Pie Charts Scatter Graphs Exam Questions
National 5 Applications of Maths Charts, Graphs and Tables Reading Tables Example 1: From the following table get the following information a) How many pupils said History was their favourite subject b) How many pupils were asked in total c) What percentage of pupils said PE (to 2 significant figures) Number of Pupils 12 10 8 6 4 2 0 Maths English History PE Science
National 5 Applications of Maths Charts, Graphs and Tables Reading Tables Example 2: The following is a line graph about the average temperature taken of a swimming pool throughout each day. Answer the following question based on the line graph. a) What day do you think the swimming pool was closed and why? b) What was the difference between the highest and lowest temperature? Average Temperature of swimming pool 35 30 25 20 15 10 5 0 Monday Tuesday Wednesday Thursday Friday Saturday Sunday
National 5 Applications of Maths Charts, Graphs and Tables Stem and Leaf Diagrams Constructing Example 1: Construct a stem and leaf chart for the data below, which shows the times in minutes in which 20 college students ran a 10 km race. 55 64 45 48 70 49 51 38 46 57 56 56 47 63 52 46 60 66 59 72
National 5 Applications of Maths Charts, Graphs and Tables Example 2: Construct a stem and leaf chart for this data which shows the engine sizes in litres of the 24 cars, vans and lorries in a service station. 1.8 2.4 3.2 1.1 1.6 1.6 1.0 2.4 3.0 1.4 2.8 3.2 5.0 4.8 1.8 4.5 2.4 1.2 5.6 1.8 2.0 4.5 1.2 1.1
National 5 Applications of Maths Charts, Graphs and Tables Reading Stem and Leaf diagrams Ordered n = 24 1 0 1 1 2 2 4 6 6 8 8 8 2 4 4 0 4 8 3 0 2 2 4 5 5 8 Key: 1/8 means 1.8 litres 5 0 6 What was the smallest engine size? How big a range was there in engine sizes? What is the median engine size?
National 5 Applications of Maths Charts, Graphs and Tables Back to back Stem and Leaf Diagrams When we have data we want to compare, it is useful to draw a Back-to- Back Stem and Leaf Chart. Example 3: Compare the growth of these plants where group A has been given feed and group B has not. Heights are given in cm. With Feed Group A Without Feed Group B 9.1 14.2 10.5 13.4 12.6 10.4 11.3 10.6 9.2 11.4 13.7 12.0 12.5 9.2 13.0 11.8 14.3 11.8 12.0 12.6 9.1 10.0 12.0 11.9 13.7 14.3 9.5 11.7 9.3 10.4 12.3 9.5 11.4 12.3 9.7 13.7 13.2 10.6 10.6 11.2 Draw a back-to-back stem and leaf chart.
National 5 Applications of Maths Charts, Graphs and Tables Back to Back Stem and Leaf Diagrams With Feed Group A Without Feed Group B 9.1 14.2 10.5 13.4 12.6 10.4 11.3 10.6 9.2 11.4 13.7 12.0 12.5 9.2 13.0 11.8 14.3 11.8 12.0 12.6 9.1 10.0 12.0 11.9 13.7 14.3 9.5 11.7 9.3 10.4 12.3 9.5 11.4 12.3 9.7 13.7 13.2 10.6 10.6 11.2
National 5 Applications of Maths Charts, Graphs and Tables Reading Pie Charts Example 1: A Pie Chart was recorded after 240 people voted on their favourite superhero. State how many people voted for each Superhero.
National 5 Applications of Maths Charts, Graphs and Tables Drawing Pie Charts Example 1: The table below shows a group of students favourite sport, construct a pie chart to show his information. Sport Frequency Angle Football 40 Rugby 30 Basketball 10 Tennis 10 Total
National 5 Applications of Maths Charts, Graphs and Tables Example 2: A survey was taken of peoples favourite ice cream, construct a pie chart to shown this information.
National 5 Applications of Maths Charts, Graphs and Tables Scattergraphs and Lines of Best Fit Types of Correlation
National 5 Applications of Maths Charts, Graphs and Tables Example 1 Marks 100 90 Student Test A Test B 60 40 80 50 70 Tom 60 40 Mary Test B 50 35 25 80 60 50 Sarah 40 90 David 30 68 20 Kyle 10 60 Alan 0 10 20 30 40 50 60 70 80 90 100 TestA
National 5 Applications of Maths Charts, Graphs and Tables A line of best fit must 1. Have the correct correlations 2. Go through as many points as possible while keeping the same amount on either side Marks 100 90 Note: It does not have to go through the origin. 80 70 Q1. Alan got 80 in test A, estimate his score in test B. 60 Test B 50 40 30 Q2. Julie got 50% in test A and therefore says she would have got 50% in test B is she correct to assume this? 20 10 0 10 20 30 40 50 60 70 80 90 100 TestA
National 5 Applications of Maths Charts, Graphs and Tables Example 2 A survey was conducted into a pupil s hand span and their shoe size. The results are shown below: a) Describe the correlation shown. b) What size feet would you expect from a pupil with a handspan of 14 cm? c) What size of handspan would you expect from a pupil with size 7 feet? Handsp an (cm) Shoe Size 15 16 18 17 15.5 13.5 20 22 18 3 4 5 5 4 3 6 8 6
National 5 Applications of Maths Charts, Graphs and Tables Exam Questions Example 1. A survey was done on the different members of staff working in a supermarket throughout a week. Given that there were 60 employees asked. a) Find the number of employees that work in management? b) What is the probability that an employee selected at random works in grocery? Chart Title Management 48o Grocery 96o Checkout 168o 42o Warehouse
National 5 Applications of Maths Charts, Graphs and Tables Exam Questions Example 2. Turn the following Bar Chart about cars that are getting on to a Ferry into a Pie Chart. Chart Title 90 80 70 60 50 40 30 20 10 0 Car Van Bike
National 5 Applications of Maths Charts, Graphs and Tables Exam Questions Example 3. A stem and leaf diagram is drawn to show battery life 19 phone for two different brands. a) State the most common battery life from Brand A. b) What is the difference in the median of both the brands? n = 19 n = 19