Understanding Correlation in Scatter Graphs
In this content, various graphs are used to demonstrate the concept of correlation in scatter graphs. It discusses positive, negative, and no correlation, showcasing how one variable affects the other. Examples and explanations are provided to help understand the relationships between different sets of data in scatter graphs.

Download Presentation

Please find below an Image/Link to download the presentation.
The content on the website is provided AS IS for your information and personal use only. It may not be sold, licensed, or shared on other websites without obtaining consent from the author. Download presentation by click this link. If you encounter any issues during the download, it is possible that the publisher has removed the file from their server.
E N D
Presentation Transcript
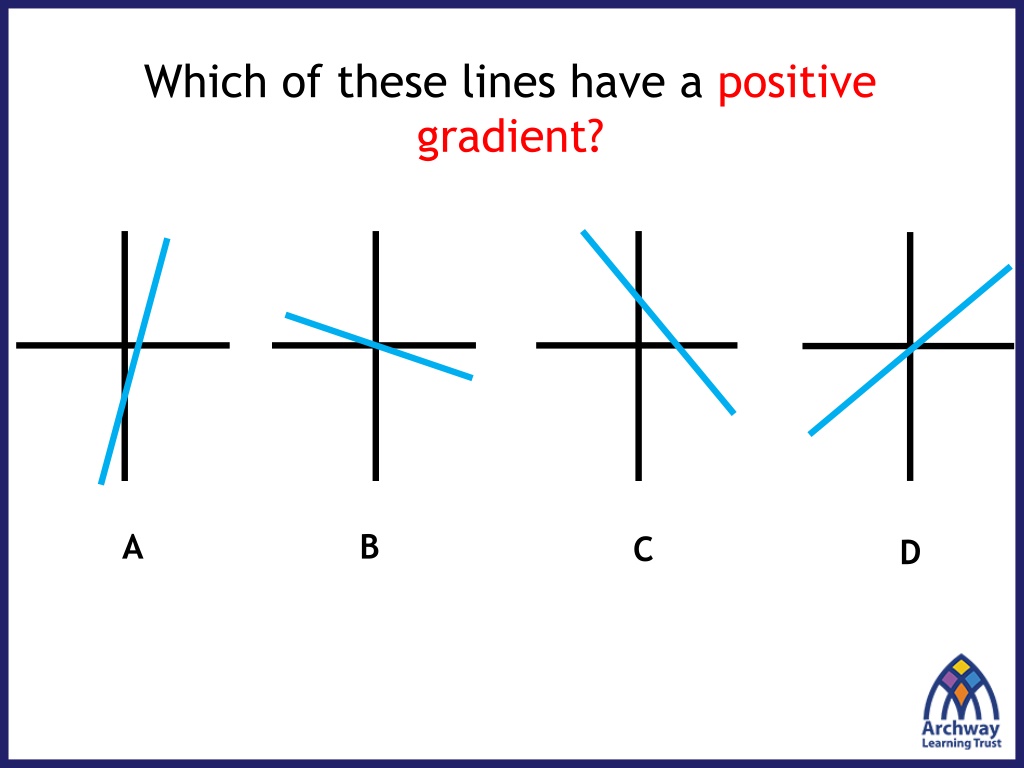
Which of these lines have a positive gradient? A B C D
Scatter Graphs Last lesson we looked at how to plot scatter graphs. What does this scatter graph show about the relationship between the height and weight of twenty Year 11 boys? 60 Weight (kg) 55 50 45 40 140 150 160 170 180 190 Height (cm) As height increases, weight increases. This is a positive correlation.
Correlation: a link or relationship between two things that happen.
Scatter Graphs Scatter graphs are used to show whether there is a relationship between two sets of data. The relationship between the data can be described as either: 1. A positive correlation. As one quantity increases so does the other. 2. A negative correlation. As one quantity increases the other decreases. 3. No correlation. Both quantities vary with no clear relationship. Soup Sales Shoe Size Height Annual Income Shoe Size Temperature No correlation Negative correlation Positive Correlation
Writing sentences This graph shows positive correlation. Write a sentence on your whiteboard to describe what the graph is showing.
Writing sentences What type of correlation does this graph show? Write a sentence on your whiteboard to describe what the graph is showing.
Writing sentences Write a sentence to explain what this scatter graph is showing.
In your books Title: Correlation For each of the graphs below, write down the type of correlation and a sentence to explain what the graph shows.
Correlation Find these three cards: All of the other cards fit into these groups. If a graph has no labels, you should write appropriate labels on the axes. Fill the blank cards with your own ideas and place in the correct group.
Worksheet For each of the sentences on the worksheet: Discuss what the graphs would look like with your partner. Copy the sentence. Draw the appropriate, labelled graph from above. Write down the type of correlation Write down a sentence.
Is this a sensible correlation? Size of fire The more firemen fighting a fire, the bigger the fire is going to be. Therefore, firemen cause fire. Number of firefighters at fire No! It s the other way around. Fire causes firemen.
Is this a sensible correlation? Deaths by drowning As ice cream sales increase, death by drowning increases sharply. Therefore, ice cream causes drowning. Ice cream sales No! They are both things that happen more in summer.
Is this a sensible correlation? As the number of pirates has decreased, global warming has increased. Number of pirates Therefore, global warming is caused by a lack of pirates. Earth s temperature No! We don t need more pirates. These are completely unrelated and are a coincidence.
Is this a sensible correlation? During summer, people get hayfever. There is also lots of pollen in the air. People suffering from hay fever Therefore, pollen causes hayfever. Amount of pollen Yes, it makes sense and there have been studies to prove it.
Correlation and causation Just because a graph seems to show correlation, it doesn t mean one thing causes the other. Sometimes another factor is involved. Sometimes it s the other way around. Sometimes it s a coincidence.
Can you give another example of reverse causation? Can you describe the three different types of correlation? What synonym could we use to replace the word specific ? What is correlation? It's often very tempting to look at statistical information, spot correlation, and then assume causation. It's a mistake that gets made often, but things are rarely this simple or straightforward. Of course, circumstances can be that straightforward occasionally, but assuming that they are is never a good idea because you will often jump to the wrong conclusions. Just because correlation is evident, that doesn't mean that A causes B. There are many variables must be examined when looking the relationship between two events. You will usually find other factors that have an impact, and it might be these factors that are responsible for the correlation. Correlation between two events or variables simply indicates that a relationship exists, whereas causation is more specific and says that one event actually causes the other. Reverse causation is as simple as its name. When you observe a correlation, it's possible to interpret it in the wrong way. Instead of seeing that A causes B, you might assume that B causes A. Consider how a solar panel works and we can see how reverse causation happens. When a solar panel generates more power, the sun is visible in the sky for longer. But that doesn't mean that the solar panel's increase in power generation causes the sun to stay in the sky for longer. Instead, the reverse is actually true. The sun was visible in the sky for longer, and this is what led to the solar panel producing more power during that period of time. What is causation? Why might correlation not necessarily lead to causation? What jobs might use correlation and causation data? What is reverse causation? Why is it a bad idea to jump to conclusions when looking at data? Describe how the solar panels are an example of reverse causation.
Can you give another example of reverse causation? Can you describe the three different types of correlation? The hotter the temperature the more ice creams sold. The reverse of the more ice creams sold, the hotter the temperature is not true. Positive, negative and none What synonym could we use to replace the word specific ? What is correlation? It's often very tempting to look at statistical information, spot correlation, and then assume causation. It's a mistake that gets made often, but things are rarely this simple or straightforward. Of course, circumstances can be that straightforward occasionally, but assuming that they are is never a good idea because you will often jump to the wrong conclusions. Just because correlation is evident, that doesn't mean that A causes B. There are many variables must be examined when looking the relationship between two events. You will usually find other factors that have an impact, and it might be these factors that are responsible for the correlation. Correlation between two events or variables simply indicates that a relationship exists, whereas causation is more specific and says that one event actually causes the other. Reverse causation is as simple as its name. When you observe a correlation, it's possible to interpret it in the wrong way. Instead of seeing that A causes B, you might assume that B causes A. Consider how a solar panel works and we can see how reverse causation happens. When a solar panel generates more power, the sun is visible in the sky for longer. But that doesn't mean that the solar panel's increase in power generation causes the sun to stay in the sky for longer. Instead, the reverse is actually true. The sun was visible in the sky for longer, and this is what led to the solar panel producing more power during that period of time. A relationship exists between 2 variables. Particular, precisely, fixed, certain, single, definite, specified, distinct What is causation? One event causes another Why might correlation not necessarily lead to causation? What jobs might use correlation and causation data? Other factors and variables could be included Buyer, weather, scientist, researchers What is reverse causation? A might cause B, but B does not cause A Why is it a bad idea to jump to conclusions when looking at data? Describe how the solar panels are an example of reverse causation. Wrong decisions might be made that cost significant sums of money, or resources put in the wrong place. The more sun, the more energy generated by solar panels. However, the more energy generated by SP, does not mean more sun.