Understanding Correlation Coefficient and Line of Best Fit
Learn how to find the correlation coefficient and create a line of best fit using statistical and regression calculations. Discover the steps involved, from setting up the calculator to analyzing the input data and determining the correlation between variables.

Download Presentation

Please find below an Image/Link to download the presentation.
The content on the website is provided AS IS for your information and personal use only. It may not be sold, licensed, or shared on other websites without obtaining consent from the author. Download presentation by click this link. If you encounter any issues during the download, it is possible that the publisher has removed the file from their server.
E N D
Presentation Transcript
Finding Correlation Coefficient & Line of Best Fit
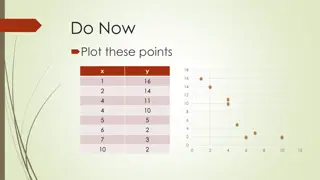
4.5 3.0 5.2 5.0 2.1 0 0 1.2 3.2 Rainfall (x cm) 5.0 8.0 0.8 4.2 4.8 7.4 9.4 8.6 2.6 No. of tourists (1000 s) We first need to make sure the calculator is CLeaR of all previous content Finding Correlation Coefficient
4.5 3.0 5.2 5.0 2.1 0 0 1.2 3.2 Rainfall (x cm) 5.0 8.0 0.8 4.2 4.8 7.4 9.4 8.6 2.6 No. of tourists (1000 s) We first need to make sure the calculator is CLeaR of all previous content 3: All Yes Reset All Finding Correlation Coefficient
4.5 3.0 5.2 5.0 2.1 0 0 1.2 3.2 Rainfall (x cm) 5.0 8.0 0.8 4.2 4.8 7.4 9.4 8.6 2.6 No. of tourists (1000 s) Statistical and Regression Calculations Put the calculator into STAT mode Finding Correlation Coefficient
4.5 3.0 5.2 5.0 2.1 0 0 1.2 3.2 Rainfall (x cm) 5.0 8.0 0.8 4.2 4.8 7.4 9.4 8.6 2.6 No. of tourists (1000 s) We have 2 variables so Select Enter the Rainfall row first pressing after each one. Go to the top of the next column Enter each frequency pressing After each one Once they have all been entered press Finding Correlation Coefficient
4.5 3.0 5.2 5.0 2.1 0 0 1.2 3.2 Rainfall (x cm) 5.0 8.0 0.8 4.2 4.8 7.4 9.4 8.6 2.6 No. of tourists (1000 s) We now need to analyse the statistics we have input Finding Correlation Coefficient
1: Type 2: Data change the type of data Edit the data 3: Sum 4: Var 5: Regression For the Line of Best fit 1: y intercept 2: Slope 3: Correlation Coefficient 4: Estimated value of x for a given value of y 5: Estimated value of y for a given value of x 1: How many terms 2(5): Mean of data 3(6): Population Standard Deviation 4(7): Sample Standard Deviation 6: Max Min Find Max/Min for each column Once you have chosen your required output you need to press
4.5 3.0 5.2 5.0 2.1 0 0 1.2 3.2 Rainfall (x cm) 5.0 8.0 0.8 4.2 4.8 7.4 9.4 8.6 2.6 No. of tourists (1000 s) We want to find the correlation coefficient Which is part of regression 5 And we use the letter r Finding Correlation Coefficient
4.5 3.0 5.2 5.0 2.1 0 0 1.2 3.2 Rainfall (x cm) 5.0 8.0 0.8 4.2 4.8 7.4 9.4 8.6 2.6 No. of tourists (1000 s) To find the Equation for the line of Best Fit Y = A + B x A A= 8.66 B B = -1.12 Line of Best Fit y = 8.66 1.12x Finding Correlation Coefficient
4.5 3.0 5.2 5.0 2.1 0 0 1.2 3.2 Rainfall (x cm) Using the Equation of the line of Best Fit 5.0 8.0 0.8 4.2 4.8 7.4 9.4 8.6 2.6 No. of tourists (1000 s) e.g. To find the value of y when x is 9 Press 9 x Then in regression choose ? (4) e.g. To find the value of x when y is 3.2 Press 3.2 Then in regression choose ? (4) Finding Correlation Coefficient
Questions 1. The marks of 7 pupils in two Maths papers are as follows : Paper 1 20 32 40 60 71 80 91 Paper 2 15 25 40 50 64 75 84 Plot the marks on a scatter graph. (Paper 1 marks on the horizontal axis and Paper 2 marks on the vertical axis) a) b) Is there any correlation between the marks on Paper 1 and Paper 2 ? c) Use your calculator to find the Correlation coefficient d) Find the equation of the Line of Best Fit for the data e) Eve achieves a score of 6 on Test A. Use the line of best fit to give an estimate of her score on Test B. Objective : To practise stating correlation.
Answers 1. Yes there is positive correlation between Paper1 and Paper 2. Test Scores 100 80 60 Paper 2 40 20 0 0 20 40 60 80 100 Paper 1
2. the engine size of a car in litres and the distance it travelled in km on one litre of petrol. Top Gear want to know if there is any correlation between engine size and distance travelled. Engine 0.8 1.6 Distance 13 10.2 a) Plot the marks on a scatter graph. b) Is there any correlation between the Engine Size and Distance Top Gear are doing a review of cars. The table below shows 2.6 5.4 12 1 2.1 7.8 1.3 11.2 1.8 8.5 c) Use your calculator to find the Correlation coefficient d) Find the equation of the Line of Best Fit for the data e) A car has a 2.3 litre engine. How far would you expect it to go on one litre of petrol ?
Answers2. Yes there is negative correlation between engine size and the distance travelled on one litre of petrol. Size of Engine & Distance Travelled 14 12 Distance Travelled . on one litre (km) 10 8 6 4 2 0 0 500 1000 1500 2000 2500 3000 Engine size (ml)