Addressing Skew and Lack of Correlation in Teacher Observation and Student Growth Data

Review the data analysis process to identify root causes of lack of correlation, develop a District Data Action Plan, and follow an Application and Approval Timeline. Receive Technical Assistance to utilize data effectively, analyze potential issues affecting student achievement, and ensure teacher evaluation consistency. Flower ISD shows a strong correlation between teacher observation and student growth, prompting deeper investigation into correlations between subjects.

Download Presentation

Please find below an Image/Link to download the presentation.
The content on the website is provided AS IS for your information and personal use only. It may not be sold, licensed, or shared on other websites without obtaining consent from the author. Download presentation by click this link. If you encounter any issues during the download, it is possible that the publisher has removed the file from their server.
E N D
Presentation Transcript
Responding to End of Year Skew ESC P revi ew J u n e 15, 2023
Objectives Review key steps in the data analysis process to determine the root cause(s) of lack of correlation and next steps Develop a draft District Data Action Plan to address areas where skew and lack of correlation exist between teacher observation and student growth data
Application and Approval Timeline Pre-Application Year 1 Year 2 Year 3 Post-Approval System Development System Application Capture Data Data Submission New or Higher Designations Expansion and Modifications Full System Approval Stakeholder Engagement TIA Teacher Buy-In Survey Expansion and Modifications Designate & Compensate Annual Program Submission Expansion & Modifications TIA Annual Evaluation Survey TIA Annual Evaluation Surveys Annual Program Submission
Technical Assistance Sequence Getting Started with Data Capture Year (Fall 2022) Data Action Planning Template & Revising Plan for Next year Implementation Calendar Using the Excel Tool & Identifying EOY Skew / Correlation Using the Excel Tool & Identifying MOY Skew / Correlation (Spring 2023) (Winter 2023) Implementation Calendar & District Plan
Data Analysis 1. Identify potential issues that negatively impact student achievement 2. Reduce inconsistencies in how teachers are evaluated 3. Ensure correlation with data points 4. Increase teacher trust in the local designation system 5. Ensure your local designation system has long-term success Why analyze teacher observation and student growth data ?
Responding to EOY Data Collect and organize teacher observation and student growth data Conduct a root cause analysis to identify factors contributing to skew Develop a plan to address the root cause
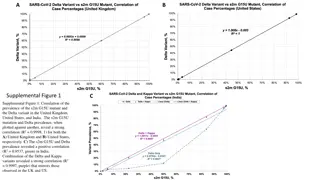
Flower ISD Correlation The correlation tab is used to provide an overview of the correlation between teacher observation and student growth data. It allows for the data to be desegrated in a variety of ways. Flower ISD has a relatively strong correlation of teacher observation scores with their student growth scores. Flower ISD s correlation between subjects will also need more investigation. Flower ISD s correlation is lower for High School. Flower ISD correlation in Grades 4 and 7 is concerning.
Teacher Observation Mid-Year Best Practices
Teacher Observation Components Correlation of Teacher Observation and Student Growth Data Teacher Observation Rubric and Appraiser Certification Observation and Feedback Schedule Reliability of Teacher Appraisers Review of Teacher Observation Trends Alignment to Statewide Performance Standards
Level 1 Data Analysis What does the current data tell us about observations in the district? How does my distribution compare to statewide teacher effectiveness data? Is the data inflated? Could we potentially over/under- designate?
Flower ISD Areas of Skew Based on the data, Flower ISD has decided to focus on improving teacher observation rating accuracy in three targeted areas: Mathematics Rose Elementary Israel Fitzgerald
Accurate Observation Ratings What does the data tell us about our observation ratings? Do they accurately reflect teacher effectiveness? Does the evidence collected support the ratings? Are they aligned with other raters across the district? If the ratings appear skewed high or low, we should: 1. Dig deeper in existing data 2. Get more data
Dig Deeper Into the Data Average T-TESS Score by Subject Taught 5 4.5 4 3.5 3 2.5 2 1.5 1 0.5 0 Special Education Special Areas ELA Math Each bar represents an individual teacher appraised at Rose Elementary.
Data Review Dig Deeper Gather More Data Review the evidence collected to determine alignment with the assigned rating Consider appraiser and teacher experience Curriculum used Sort Data by Subject Grade Level Rubric Dimensions
Inaccurate Observation Scores Determine the root cause(s) by asking questions and consider what has or has not happened to support appraiser calibration and teacher instructional practices. 1. How many opportunities, for appraisers to calibrate were offered throughout the year? 2. How experienced are appraisers? 3. What support has been provided to support teachers with the content? Observation scores are not accurate. Now what?
Determine the Root Cause Root Cause Analysis Process Root Cause Analysis Protocols Five Why s Fishbone Circle Map Diagnostic Tree Affinity Diagram Cause Mapping 1. Define the problem 2. Gather data 3. Determine possible causal factors 4. Identify the root cause(s) 5. Recommend and implement solutions
Fishbone Example Observation Schedule New Appraiser Done during last two weeks Lack of content knowledge Limited Rubric Training No walk- throughs Problem Over inflated observation scores at Rose Elementary No campus calibrations Lack Understanding Of Rubric No Look Fors Documents Limited Feedback Perception of Proficient Rating Lack of Aligned Evidence
Flower ISD Action Plan Trend to Address Root Cause(s) Next Steps First year appraiser Limited mid-year coaching Heavy novice teacher case load Appraiser: Israel Fitzgerald School culture in which appraisers and teachers see proficient as barely meeting expectations. Campus: Rose Elementary Lack of quality evidence that supports the rating Subject: Mathematics
Flower ISD Action Plan cont. Trend to Address Root Cause(s) Next Steps First year appraiser Limited mid-year coaching Heavy teacher case load Establish monthly one-on-one co- observations and coaching Move two teachers from caseload Appraiser: Israel Fitzgerald School culture in which appraisers and teachers see proficient as barely meeting expectations. Implement appraiser and teacher training to establish school-wide expertise on the observation rubric Campus: Rose Elementary Lack of quality evidence that supports the rating Develop a Look Fors document for appraisers to support evidence collection in mathematics Subject: Mathematics
Additional Targeted Next Steps Appraiser Level Teacher Level Utilize recorded video lessons to calibrate appraisers Schedule co-observations with appraisers Revise Calibration Calendar Facilitate professional learning sessions Content Quality Evidence Collection Assign peer mentors Implement targeted PLC support for teachers Support teachers with real-time coaching during lessons Increase number of observations and feedback provided
NIET EE PASS Supports appraisers by providing a video library with a variety of grade levels and content areas. Sign up for NIET EE PASS on TIA Website Free!
Teacher Observation End of Year Best Practices 1. Collect and organize observation data 2. Analyze observation data 3. Conduct root cause analysis 4. Create an action plan with targeted next steps 5. Communicate with all stakeholders Findings from data analysis Action Plan
Analyzing Student Growth Data Root Causes of Lack of Correlation Between Teacher Observation and Student Growth Data
District System Components Teacher Observation Observation based on T-TESS or aligned rubric . District application must show evidence of calibration and data analysis Student Growth Student growth measures determined by district. District application must show evidence of validity & reliability of development, administration, and scoring Districts must spend at least 90% on teacher compensation for student-facing instructional roles and may reserve up to 10% for supporting the TIA system or in supporting teachers in earning a designation by 8/31 each year. Spending Plan Optional Components Districts may consider additional factors in make designations (e.g., mentoring other teachers, teacher leadership, family surveys, student surveys, etc.).
Questions to Ask: Analyzing Student Growth Data How does my distribution compare to statewide teacher effectiveness data? Could we potentially over/under-designate? What does my data look like by teacher category? Is the data inflated?
Common Root Causes for Invalid Student Growth Data Skewed growth targets Districts should evaluate various aspects of implementation to determine root cause(s) for identified skew. Student mobility & attendance rates Inadequate protocols Assessments misaligned to course content Misaligned implementation
Inadequate Protocols Lack of strong training and protocols around assessment security, administration, and scoring. Students performed well on the post-test. However, teachers realize that familiarity may have skewed the assessment results. Team realizes they need to approach the test design differently the following year. District created pre- and post-tests with questions that are almost identical to assess student learning. Teachers recycled test questions to support practice opportunities. Students became highly familiar with test questions throughout the year.
Assessments Misaligned to Course Content Student growth measures don t adequately assess what students should learn over the course of the school year. The scores for this district are skewed with almost 100% of teachers meeting their goal. Student growth data reveals skew because teachers show 100% of their students showed growth.
Skewed Growth Targets Student growth targets are set too low or too high. District submits data that shows 100% of its teachers using SLOs had their students' meet growth. In this case, the district did not pass data validation because of skew. Teachers felt that the skills they are working on with students should not be too rigorous based on the local context. Midway through the year, it is determined that most of the students have already met their growth goals. District determined that the growth targets were too low and 100% of teachers met their growth goals.
Student Mobility & Attendance Rates Mobility Rates Teams are encouraged to understand and identify factors that are outside of a teacher's locus of control which may be part of, or contribute to, root causes that impact the data set(s). Lesson Planning Teacher Classroom Management Attendance
Misaligned Implementation Lack of campus/district oversight of the SGM implementation. At the end of the school year Portfolios are scored without calibrating. Each teacher submitted a different number of artifacts of varying quality, which impacted the district's data set for this campus. Administrator missed the Portfolio training and pre-calibration dates that happened during the beginning of the Year PD. Teachers started the year with minimal support. The administrator does not understand the process or the requirements to implement Portfolios and relies on teachers to continue with the work they started in the fall.
Flower ISD Action Plan: Root Causes Area of Lack of Correlation Root Cause(s) Next Steps High School Physical Education (ex. Provided in the Data Action Planning Template) Lack of validity & reliability in student growth measures Lack of strong SGM administration and scoring procedures, specifically around SLOs Lack of district-level oversight of SGM process, specifically around SLOs Setting TSP goals too high Elementary School Teachers Lack of school-wide practices that yield student growth goals setting regular review of and response to academic data consistent feedback to students and families List some possible next steps in the chat.
Flower ISD Action Plan: Next Steps Area of Lack of Correlation Root Cause(s) Next Steps High School Physical Education (ex. Provided in the Data Action Planning Template) Lack of validity & reliability in student growth measures Lack of strong SLO administration and scoring procedures Lack of district-level oversight of SLO process Facilitate a SLO booster training for teachers and campus administrators. Implement SLO scorer calibration. Create an SLO committee with representation from district leaders and all campuses that use SLOs to support in strong implementation of SLOs. Rose Elementary School Teachers Lack of school-wide practices that yield student growth goals setting regular review of and response to academic data consistent feedback to students and families Schedule one on one goal setting conferences between teacher and student Implement a parent newsletter Facilitate Meet the Teacher nights Implement meaningful data analysis protocols as part of PLCs
Targeted Next Steps Right Now Next Year Retrain/reinvest in teachers and/or administrators on Student Growth Measure implementation. Implement SGM scoring training including calibrating the scorers. Drive a culture of achievement that results in students performing at their highest potential on assessments. Revise current protocols to appropriately address student-based causes such as attendance. Retrain teachers on assessment procedures and protocols. Consider adopting student growth measures that better assess what students will learn over the course of the school year. Ensure strong training and protocols around assessment security, administration, and scoring. Reevaluate whether student growth targets are sufficiently attainable and rigorous.
Best Practices for Data Review Look for correlation between student growth data and observation data Look for skew across campuses, grade levels, content areas, etc. Determine the root cause of skew when data shows there is a lack of correlation Appraiser Calibration Teacher Instructional Practice Unreliable Student Growth Measure (SGM) Determine steps to address root cause of skew
Questions? What questions do you have?
Find More Resources Online Visit us at tiatexas.org/resources to find the resources you need. Setting Expected Growth Targets Webinar Overview of Pre-test/Post-test Overview of Texas SLO Overview of Portfolios
Thank You Contact Information: TIA@tea.texas.gov