Correlation of s2m G15U Mutant and Delta Variant Prevalence
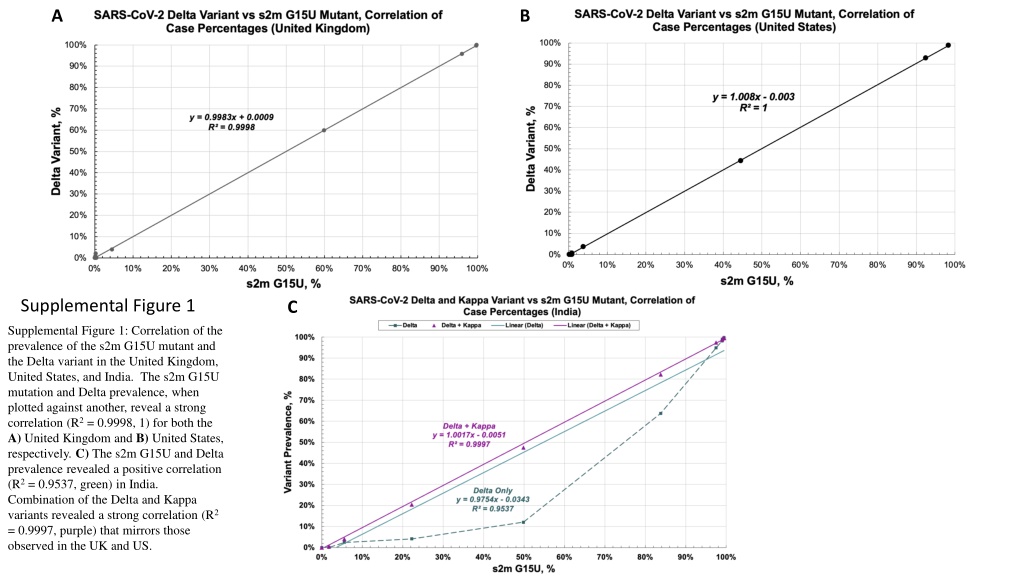

A
B
C
Supplemental Figure 1
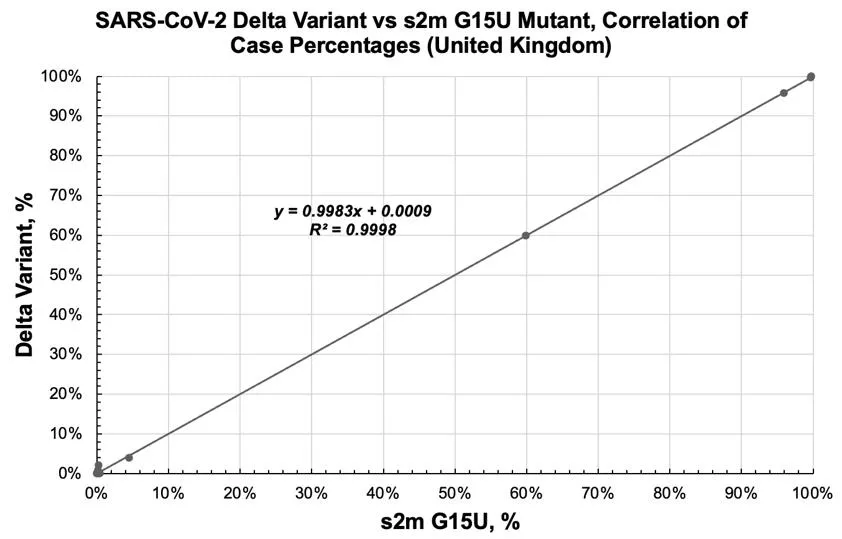
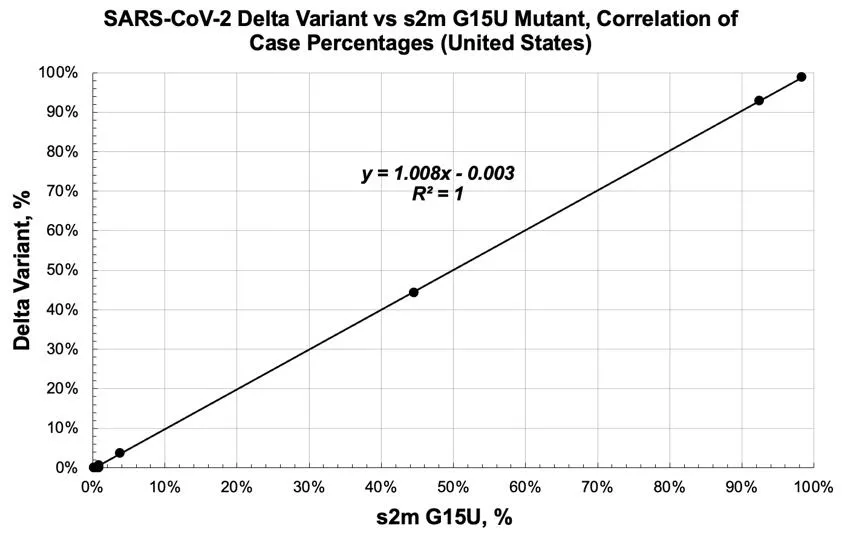
Supplemental Figure 1: Correlation of the
prevalence of the s2m G15U mutant and
the Delta variant in the United Kingdom,
United States, and India. The s2m G15U
mutation and Delta prevalence, when
plotted against another, reveal a strong
correlation (R
2
= 0.9998, 1) for both the
A)
United Kingdom and
B)
United States,
respectively.
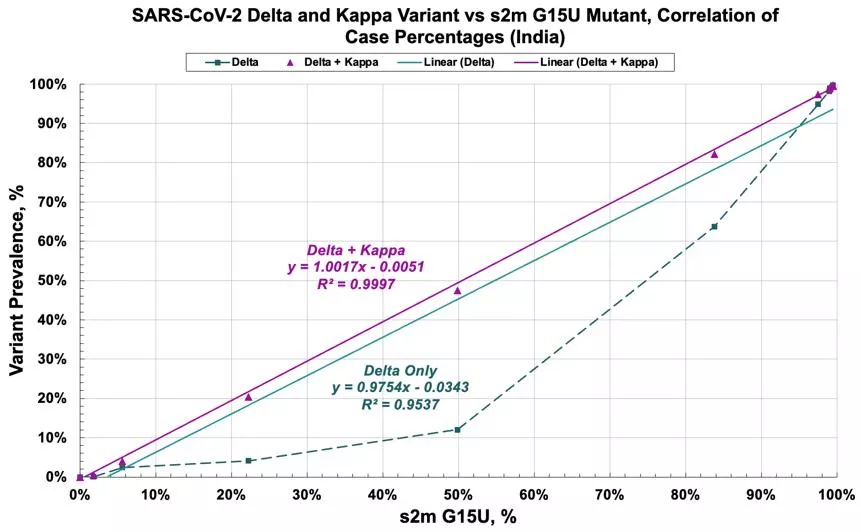
C)
The s2m G15U and Delta
prevalence revealed a positive correlation
(R
2
= 0.9537, green) in India.
Combination of the Delta and Kappa
variants revealed a strong correlation (R
2
= 0.9997, purple) that mirrors those
observed in the UK and US.

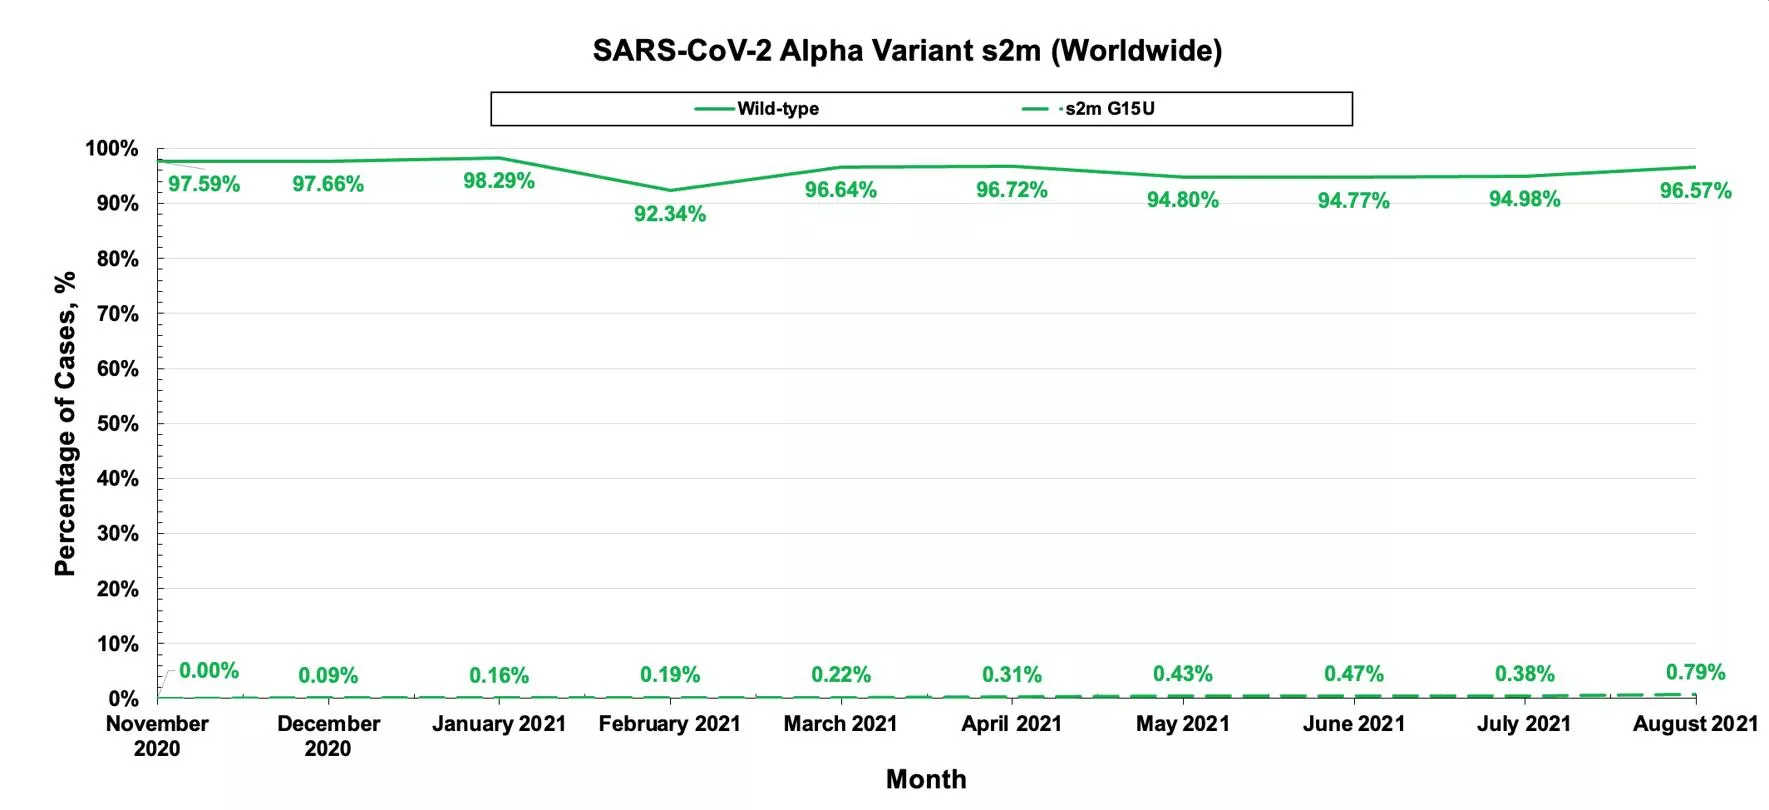
Supplemental Figure 2: Analysis of the s2m phenotype within the Alpha variant. Sequence analysis of the Alpha variant revealed that over
time, Alpha comprised largely of the wild-type s2m and contained a small percentage of s2m G15U mutant.
Supplemental Figure 3: Analysis of the s2m phenotype within the Delta and Kappa variants. Sequence analysis of the Delta and Kappa
variants revealed that over time, both variants comprised largely of the s2m G15U mutant.
Supplemental Figure 4. First derivative data of UV thermal denaturation melt experiments for the
2m and s2m G15U.
The correlation between the prevalence of the s2m G15U mutant and the Delta variant in the UK, US, and India was analyzed, showing strong correlations in the UK and US, and a positive correlation in India. Analysis of the s2m phenotype in the Alpha, Delta, and Kappa variants was also conducted. Additionally, UV thermal denaturation melt experiments for 2m and s2m G15U were performed.

Download Presentation

Please find below an Image/Link to download the presentation.
The content on the website is provided AS IS for your information and personal use only. It may not be sold, licensed, or shared on other websites without obtaining consent from the author. Download presentation by click this link. If you encounter any issues during the download, it is possible that the publisher has removed the file from their server.
E N D
Presentation Transcript
A B Supplemental Figure 1 C Supplemental Figure 1: Correlation of the prevalence of the s2m G15U mutant and the Delta variant in the United Kingdom, United States, and India. The s2m G15U mutation and Delta prevalence, when plotted against another, reveal a strong correlation (R2 = 0.9998, 1) for both the A) United Kingdom and B) United States, respectively. C) The s2m G15U and Delta prevalence revealed a positive correlation (R2 = 0.9537, green) in India. Combination of the Delta and Kappa variants revealed a strong correlation (R2 = 0.9997, purple) that mirrors those observed in the UK and US.
Supplemental Figure 2: Analysis of the s2m phenotype within the Alpha variant. Sequence analysis of the Alpha variant revealed that over time, Alpha comprised largely of the wild-type s2m and contained a small percentage of s2m G15U mutant.
Supplemental Figure 3: Analysis of the s2m phenotype within the Delta and Kappa variants. Sequence analysis of the Delta and Kappa variants revealed that over time, both variants comprised largely of the s2m G15U mutant.
Supplemental Figure 4. First derivative data of UV thermal denaturation melt experiments for the 2m and s2m G15U.