Understanding Causal Inference and Causal Graphs in Drug Efficacy Studies

This content delves into the concept of causal inference using causal graphs, specifically focusing on the relationship between a drug (D) and its effectiveness in curing a condition (C). It discusses the importance of distinguishing correlation from causation and explores scenarios where confounding variables may impact study outcomes, leading to incorrect conclusions about the drug's efficacy. Through examples and analysis of randomized studies, the content highlights the complexities involved in determining causal relationships in medical research.

Download Presentation

Please find below an Image/Link to download the presentation.
The content on the website is provided AS IS for your information and personal use only. It may not be sold, licensed, or shared on other websites without obtaining consent from the author. Download presentation by click this link. If you encounter any issues during the download, it is possible that the publisher has removed the file from their server.
E N D
Presentation Transcript
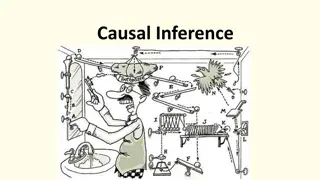
Causal Inference Causal Graph D (Drug) C (Cure) Jeff Edmonds York University & David Madras
Causal Graph Causal Inference D (Drug) X (Young/Old) Coloration does not mean causation! Coloration: D and C tend to happen at the same time. Maybe D causes C. Maybe C causes D. Maybe X causes C and D. What does cause even mean? C (Cure)
Causal Graph Does the drug cause the cure? Choose 100 random people. Randomly give half the drug. Watch whether they are cured. Causal Inference D (Drug) C (Cure) D (No Drug) # people = 50 # Cured = 25 pr[ C | D ] pr[C|D] - pr[C| D] = 0.66-0.50 = 0.16 D (Drug) # people = 50 # Cured = 33 pr[ C | D ] = 33/50 = 0.50 # people = 100 = 25/50 = 0.66 Drug works
Causal Graph I will save money. Choose 100 random people. Watch which drugs they take and whether they are cured. Causal Inference D (Drug) X (Young/Old) Just a coincidence that half took the drug. C (Cure) D (No Drug) # people = 50 # Cured = 33 pr[ C | D ] = 33/50 = 0.66 pr[C|D] - pr[C| D] = 0.50-0.66 = -0.16 Drug doesn't work Just a coincidence that it is reverse answer. D (Drug) # people = 50 # Cured = 25 pr[ C | D ] = 25/50 = 0.50 # people = 100 What went wrong? Maybe there was an Confounder effecting things. Confounder: a variable which causally effects both the treatment (T) and the outcome (Y)
Causal Graph I will save money. Choose 100 random people. Watch which drugs they take and whether they are cured. Causal Inference D (Drug) X (Young/Old) Separate our people into these young/old. C (Cure) D (No Drug) # people = 50 # Cured = 33 pr[ C | D ] = 33/50 = 0.66 pr[C|D] - pr[C| D] = 0.50-0.66 = -0.16 Drug doesn't work D (Drug) # people = 50 # Cured = 25 pr[ C | D ] = 25/50 = 0.50 # people = 100 (= 10 +40) (= 9 + 16) (= 44 + 6) (= 31 + 2) X (Young) # people = 44 # Cured = 31 # people = 10 # Cured = 9 # people = 40 # Cured = 16 # people = 6 # Cured = 2 X (Old)
Causal Graph I will save money. Choose 100 random people. Watch which drugs they take and whether they are cured. Causal Inference D (Drug) X (Young/Old) Does the drug help the cure for young/old? Calculate the prob of a cure for each of the four groups. C (Cure) D (No Drug) # people = 50 # Cured = 33 pr[ C | D ] = 33/50 = 0.66 pr[C|D] - pr[C| D] = 0.50-0.66 = -0.16 Drug doesn't work D (Drug) # people = 50 # Cured = 25 pr[ C | D ] = 25/50 = 0.50 # people = 100 (= 10 +40) (= 9 + 16) (= 44 + 6) (= 31 + 2) Paradox! Drug works X (Young) # people = 44 # Cured = 31 # people = 10 # Cured = 9 = 31/44= 0.70 pr[ C | D & X ] = 9/10= 0.90 pr[ C | D & X ] pr[ C | D & X ] - pr[ C | D & X ] = 0.90 0.70 = 0.20 # people = 40 # Cured = 16 pr[ C | D & X ] # people = 6 # Cured = 2 pr[ C | D & X] pr[ C | D & X ] - pr[ C | D & X ] = 0.40 0.33 = 0.07 X (Old) = 16/40= 0.40 = 2/6 = 0.33
Causal Graph I will save money. Choose 100 random people. Watch which drugs they take and whether they are cured. Causal Inference D (Drug) X (Young/Old) But many things influence the cure. This does not create a paradox. Not surprising. The old don t cure as well. C (Cure) D (No Drug) # people = 50 # Cured = 33 pr[ C | D ] = 33/50 = 0.66 pr[C|D] - pr[C| D] = 0.50-0.66 = -0.16 Drug doesn't work D (Drug) # people = 50 # Cured = 25 pr[ C | D ] = 25/50 = 0.50 # people = 100 (= 10 +40) (= 9 + 16) (= 44 + 6) (= 31 + 2) Drug works X (Young) # people = 44 # Cured = 31 # people = 10 # Cured = 9 pr[ C | D & X ] pr[ C | D & X ] = 0.90 = 9/10 = 0.70 = 31/44 # people = 40 # Cured = 16 # people = 6 # Cured = 2 X (Old) pr[ C | D & X] = 0.40 pr[ C | D & X ] = 16/40 = 0.33 = 2/6
Causal Graph I will save money. Choose 100 random people. Watch which drugs they take and whether they are cured. Causal Inference D (Drug) X (Young/Old) Does the drug cause the cure? Choose 100 random people. Randomly give half the drug. Watch whether they are cured. C (Cure) Drug doesn't work Drug works D (No Drug) D (Drug) X (Young) # people = 44 # Cured = 31 # people = 10 # Cured = 9 pr[ C | D & X ] pr[ C | D & X ] = 0.90 = 9/10 = 0.70 = 31/44 # people = 40 # Cured = 16 # people = 6 # Cured = 2 X (Old) pr[ C | D & X] = 0.40 pr[ C | D & X ] = 16/40 = 0.33 = 2/6
Yes: Old people use the drug more. Watch which drugs they take Causal Graph Causal Inference D (Drug) Randomly give half the drug. X (Young/Old) What s going on? Maybe age effects who uses the drug. C (Cure) Drug doesn't work Drug works D (No Drug) D (Drug) X (Young) # people = 44 # Cured = 31 # people = 10 # Cured = 9 pr[ C | D & X ] pr[ D | X ] = 10/(44+10) = 0.19 pr[ C | D & X ] pr[ D | X] = 44/(44+10) = 0.81 = 0.90 = 9/10 = 0.70 = 31/44 # people = 40 # Cured = 16 # people = 6 # Cured = 2 X (Old) pr[ C | D & X] pr[ D | X ] = 6/(6+40) = 0.13 = 0.40 pr[ C | D & X ] pr[ D | X ] = 40/(6+40) = 0.87 = 16/40 = 0.33 = 2/6
Yes: Old people use the drug more. Watch which drugs they take Causal Graph Causal Inference D (Drug) Randomly give half the drug. X (Young/Old) What s going on? The two most populated groups are on the diagonal. And these groups make the drug look bad. Not because of the effect of the drug on the cure but because of the effect of age on it. Maybe age effects who uses the drug. C (Cure) Why does this matter? Drug doesn't work Drug works D (No Drug) D (Drug) X (Young) # people = 44 # Cured = 31 # people = 10 # Cured = 9 pr[ C | D & X ] pr[ D | X ] = 10/(44+10) = 0.19 pr[ C | D & X ] pr[ D | X] = 44/(44+10) = 0.81 = 0.90 = 9/10 = 0.70 = 31/44 # people = 40 # Cured = 16 # people = 6 # Cured = 2 X (Old) pr[ C | D & X] pr[ D | X ] = 6/(6+40) = 0.13 = 0.40 pr[ C | D & X ] pr[ D | X ] = 40/(6+40) = 0.87 = 16/40 = 0.33 = 2/6
Watch which drugs they take Causal Graph Causal Inference D (Drug) Randomly give half the drug. X (Young/Old) Lets try to fix it. Which numbers are ground truth about drug cure I can tell you those. C (Cure) Drug doesn't work Drug works D (No Drug) D (Drug) X (Young) # people = 44 # Cured = 31 # people = 10 # Cured = 9 pr[ C | D & X ] pr[ D | X ] = 10/(44+10) = 0.19 pr[ C | D & X ] pr[ D | X] = 44/(44+10) = 0.81 = 0.90 = 9/10 = 0.70 = 31/44 # people = 40 # Cured = 16 # people = 6 # Cured = 2 X (Old) pr[ C | D & X] pr[ D | X ] = 6/(6+40) = 0.13 = 0.40 pr[ C | D & X ] pr[ D | X ] = 40/(6+40) = 0.87 = 16/40 = 0.33 = 2/6
Watch which drugs they take Causal Graph Causal Inference D (Drug) Randomly give half the drug. X (Young/Old) Lets try to fix it. Which numbers are ground truth about drug cure I can tell you those. C (Cure) These were weighted by the wrong group sizes. Drug doesn't work Drug works D (No Drug) D (Drug) X (Young) # people = 44 # people = 10 pr[ C | D & X ] pr[ C | D & X ] = 0.90 = 0.70 # people = 40 # people = 6 X (Old) pr[ C | D & X] = 0.40 pr[ C | D & X ] = 0.33
Watch which drugs they take Causal Graph Causal Inference D (Drug) Randomly give half the drug. X (Young/Old) Lets try to fix it. Try to make the group sizes the way I do. Choose 100 random people. How many are young/old depends on the ground young/old probabilies. Randomly give half the drug. C (Cure) I can tell you those. Drug doesn't work Drug works 54/2 = 27 D (No Drug) D (Drug) X (Young) pr[ X] = (44+10)/100 = 0.54 # people = 44 54/2 = 27 # people = 10 pr[ C | D & X ] pr[ C | D & X ] = 0.90 = 0.70 # X = pr[ X] # = 54 46/2 = 23 # people = 40 # people = 6 46/2 = 23 X (Old) pr[X] = (6+40)/100 = 0.46 #X = pr[X] # = 46 pr[ C | D & X] = 0.40 pr[ C | D & X ] = 0.33
Watch which drugs they take Causal Graph Causal Inference D (Drug) Randomly give half the drug. X (Young/Old) Lets try to fix it. How many of these should be cured? C (Cure) Remember I gave you the ground truth about cure probabilities. D (No Drug) D (Drug) X (Young) # people = 44 # Cured = 31 54/2 = 27 0.70 27 = 19 54/2 = 27 0.90 27 = 24 # people = 10 # Cured = 9 pr[ C | D & X ] pr[ C | D & X ] = 0.90 = 0.70 46/2 = 23 0.40 23 = 9 # people = 40 # Cured = 16 # people = 6 # Cured = 2 46/2 = 23 0.33 23 = 6 X (Old) pr[ C | D & X] = 0.40 pr[ C | D & X ] = 0.33
Watch which drugs they take Causal Graph Causal Inference D (Drug) Randomly give half the drug. X (Young/Old) Lets try to fix it. Now compute whether the drug helps the cure. D (No Drug) # people = 27 + 23 = 50 # Cured = 19 + 6 = 25 pr[ C | D ] = 25/50 = 0.50 pr[C|D] - pr[C| D] = 0.66-0.50 = 0.16 C (Cure) D (Drug) # people = 27 + 23 = 50 # Cured = 24 + 9 = 33 pr[ C | D ] = 33/50 = 0.66 Drug works X (Young) # people = 44 # Cured = 31 54/2 = 27 0.70 27 = 19 54/2 = 27 0.90 27 = 24 # people = 10 # Cured = 9 pr[ C | D & X ] pr[ C | D & X ] = 0.90 = 0.70 46/2 = 23 0.40 23 = 9 # people = 40 # Cured = 16 # people = 6 # Cured = 2 46/2 = 23 0.33 23 = 6 X (Old) pr[ C | D & X] = 0.40 pr[ C | D & X ] = 0.33
Causal Graph Causal Inference D (Drug) X (Young/Old) These numbers are exactly what we got from a fair experiment. C (Cure) D (No Drug) # people = 27 + 23 = 50 # Cured = 19 + 6 = 25 pr[ C | D ] = 25/50 = 0.50 pr[C|D] - pr[C| D] = 0.66-0.50 = 0.16 D (Drug) # people = 27 + 23 = 50 # Cured = 24 + 9 = 33 pr[ C | D ] = 33/50 = 0.66 Drug works Does the drug cause the cure? Choose 100 random people. Randomly give half the drug. Watch whether they are cured. But I saved money. by watch which drugs people take and whether they are cured.
An other classic paradox. Do women make as much money as men? Causal Graph Causal Inference Gender Job This causation arrow is the other way Salary Women Men # people = 100 Salary = $45,000 # people = 10 Salary = $40,000 Secretary # people = 10 Salary = $105,000 # people = 100 Salary = $100,000 Boss
Do women get equal pay for equal work? Causal Graph Causal Inference Gender Job In each job, women get paid more! Salary Women Men # people = 100 Salary = $45,000 # people = 10 Salary = $40,000 Secretary # people = 10 Salary = $105,000 # people = 100 Salary = $100,000 Boss
Causal Graph Causal Inference Do women get equal pay? Gender Job Salary No: Avgmen(salary) = 10/110 $40k + 100/110 $100k = $95,000 Avgwomen(salary) = 100/110 $40k + 10/110 $100k = $46,000 Women Men # people = 100 Salary = $45,000 # people = 10 Salary = $40,000 Secretary # people = 10 Salary = $105,000 # people = 100 Salary = $100,000 Boss
Causal Graph Causal Inference Do women get equal pay? Gender Job Salary The problem is that women are directed into jobs that payless Women Men # people = 100 Salary = $45,000 # people = 10 Salary = $40,000 Secretary # people = 10 Salary = $105,000 # people = 100 Salary = $100,000 Boss
Intro toCausality David Madras October 22, 2019
The Monty Hall Problem 1. Three doors 2 have goats behind them, 1 has a car (you wantto win the car) 2. You choose a door, but don t openit 3. The host, Monty, opens another door (not the one you chose),and shows you that there is a goat behind thatdoor 4. Younow have the option to switch yourdoor fromthe one you chose to the other unopeneddoor 5. What should you do? Should youswitch?
Causation !=Correlation In machine learning, we try to learn correlations from data When can we predict X from Y? In causal inference, we try to modelcausation When does X causeY? These are not thesame! Ice cream consumption correlates with murderrates Ice cream does not cause murder(usually)
Correlations Can BeMisleading https://www.tylervigen.com/spurious-correlations
Causal Modelling Twooptions: 1. Run a randomizedexperiment
Causal Modelling Twooptions: 1. Run a randomizedexperiment 2. Make assumptions about how our data isgenerated
CausalDAGs Pioneered by JudeaPearl Describes generative process ofdata
CausalDAGs Pioneered by JudeaPearl Describes (stochastic) generative process ofdata
CausalDAGs T is a medical treatment Y is a disease X are other featuresabout patients (say, age) We want to know the causal effect of our treatment on thedisease.
CausalDAGs Experimental data: randomized experiment We decide which people shouldtake T Observational data: no experiment People chose whether or not totake T Experiments are expensive andrare Observations can bebiased E.g. What if mostlyyoungpeoplechoose T?
Asking CausalQuestions Suppose T is binary (1: received treatment, 0: did not) Suppose Y is binary (1: disease cured, 0: disease not cured) We want to know If we give someone the treatment (T = 1), what is the probability they are cured (Y = 1)? This is not equal to P(Y = 1 | T = 1) Suppose mostly young people take the treatment, and mostwere cured, i.e. P(Y = 1 | T = 1) is high Is this because the treatment is good? Or because theyare young?
Correlation vs.Causation Correlation In the observed data, how often dopeople who take the treatment become cured? The observed data may be biased!!
Correlation vs. Causation Let s simulate a randomized experiment i.e. Cut the arrow from X toT This is called ado-operation Then, we can estimate causation:
Correlation vs. Causation Correlation Causation treatment is independent of X
Inverse Propensity Weighting Can calculate this using inverse propensity scores Rather than adjusting for X, sufficient to adjust for P(T | X) P(T | X)
Inverse Propensity Weighting Can calculate this using inverse propensity scores These are called stabilized weights
Matching Estimators Match up samples with different treatments that are near to each other Similar toreweighting
Review: What to do with a causalDAG The causal effect of T on Yis This is great! But we ve made someassumptions.
Simpsons Paradox, Explained Size Trmt Y
Simpsons Paradox, Explained Size Trmt Y
Monty Hall Problem,Explained Boringexplanation:
Monty Hall Problem, Explained Causal explanation: My door location is correlated with the car location, conditioned on which door Montyopens! MyDoor CarLocation Opened Door https://twitter.com/EpiEllie/status/1020772459128197121
Monty Hall Problem, Explained Causal explanation: My door location is correlated with the car location, conditioned on which door Montyopens! This is because Montywon t show me the car If he s guessing also, then correlation disappears MyDoor CarLocation Monty s Door
Structural Assumptions All of this assumes that our assumptions about the DAG that generated our data arecorrect Specifically, we assume that there are no hidden confounders Confounder: a variable which causally effects both thetreatment (T) and the outcome(Y) No hidden confounders means that we have observedall confounders This is a strong assumption!
HiddenConfounders Cannot calculate P(Y | do(T)) here, since U is unobserved X U We say in this case that the causal effect is unidentifiable Even in the case of infinite data and computation, we can never calculatethis quantity T Y