Understanding Speed vs. Time Graphs: Analyzing Acceleration and Motion


Speed vs. Time
Graphs
Introduction


Learning Objectives
•
I can recognize acceleration on a
speed vs. time graph.
•
I can recognize speed on a speed
vs. time graphs.
•
I can analyze motion on a speed vs.
time graphs.
•
I can calculate slope (acceleration)
on a speed vs. time graph
On your paper, Label graph axes as
shown
What type of
graph is this?
Explain why.
S
t
•
This is a acceleration graph because it shows
a change in speed over time (a = s/t).
•
The slope of the line on the graph will equal
the acceleration. SLOPE =
acceleration (higher slope = higher
acceleration)
S
t
•
What would a graph showing an object
moving at a constant acceleration look
like? Try to draw it.
S
t
C
o
n
s
t
a
n
t
a
c
c
e
l
e
r
a
t
i
o
n
S
t
Now, on the same graph, use a
dashed line to show a second object
with a SLOWER constant acceleration
.
S
t
2 constant speeds,
one faster
,
one slower
Try drawing an acceleration graph that shows an
object where the
acceleration increases
.
S
t
Try drawing an acceleration graph that shows an
object where the
acceleration decreases
.
S
t
Try drawing an acceleration graph that shows an
object that has
constant deceleration
.
S
t
Try drawing an acceleration graph that shows an
object where the
deceleration decreases
.
S
t
Try drawing a acceleration graph that shows an
object where the
deceleration increases
.
S
t
Try drawing an acceleration graph that shows no
acceleration
.
S
t
Try drawing an acceleration graph that
shows an object that travels at a
constant
acceleration
, then
acceleration decreases
,
then has no
acceleration
?
S
t
constant acceleration
accelerates slower
no acceleration
S
t
Find the acceleration/slope for A
A
B
Y
2
=
Y
1
=
X
2
=
X
1
=
2400m/min
0m/min
15min
0min
2400m/min -
0m/min
15min -
0min
2400m/min
15min
=
160m/min/min
=
Speed m/min
Find the acceleration/slope for B
A
B
Y
2
=
Y
1
=
X
2
=
X
1
=
400m/min
0m/min
20min
0min
400m/min -
0m/min
20min -
0min
400m/min
20min
=
20m/min/min
=
Speed m/min
All the accelerations
Speed m/min
A
B
Big Ideas
•
The slope on a speed vs. time graph
represents
ACCELERATION.
•
A flat line on a speed vs. time graph
means you are not accelerating.
(Moving at a constant speed)
Explore the concept of speed vs. time graphs and learn how to recognize acceleration, interpret speed, analyze motion, and calculate acceleration from the slope of the graph. Discover the characteristics of graphs showing constant acceleration, varying acceleration, and deceleration. Engage in drawing exercises to visualize different scenarios of object movement on these graphs.

Download Presentation

Please find below an Image/Link to download the presentation.
The content on the website is provided AS IS for your information and personal use only. It may not be sold, licensed, or shared on other websites without obtaining consent from the author. Download presentation by click this link. If you encounter any issues during the download, it is possible that the publisher has removed the file from their server.
E N D
Presentation Transcript
Speed vs. Time Graphs Introduction
Learning Objectives I can recognize acceleration on a speed vs. time graph. I can recognize speed on a speed vs. time graphs. I can analyze motion on a speed vs. time graphs. I can calculate slope (acceleration) on a speed vs. time graph
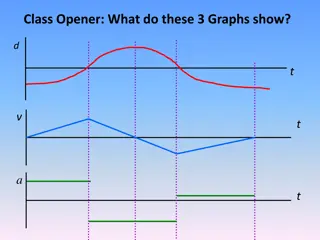
On your paper, Label graph axes as shown What type of graph is this? Explain why. S S t t
This is a acceleration graph because it shows a change in speed over time (a = s/t). The slope of the line on the graph will equal the acceleration. SLOPE = acceleration (higher slope = higher acceleration) ???? ???= ????? ???? ????? = = ???????????? S S t t
What would a graph showing an object moving at a constant acceleration look like? Try to draw it. S S t t
Constant acceleration Constant acceleration S S t t
Now, on the same graph, use a dashed line to show a second object with a SLOWER constant acceleration. 2 constant speeds, one faster, one slower S S t t
Try drawing an acceleration graph that shows an object where the acceleration increases. S S t t
Try drawing an acceleration graph that shows an object where the acceleration decreases. S S t t
Try drawing an acceleration graph that shows an object that has constant deceleration. S S t t
Try drawing an acceleration graph that shows an object where the deceleration decreases. S S t t
Try drawing a acceleration graph that shows an object where the deceleration increases. S S t t
Try drawing an acceleration graph that shows no acceleration. S S t t
Try drawing an acceleration graph that shows an object that travels at a constant acceleration, then acceleration decreases, then has no acceleration? S S t t
accelerates slower no acceleration constant acceleration S S t t
Find the acceleration/slope for A Slope = rise run = speed time = y2 y1 X2 X1 = acceleration 2400m/min Y2 = ???? ???= y2 y1 X2 X1 = A A) 2400m/min - 0m/min = 15min - 0min Speed m/min 15min 2400m/min B =160m/min/min 15min X2 = 0m/min Y1 = 0min X1 =
Find the acceleration/slope for B Slope = rise run = speed time = y2 y1 X2 X1 = acceleration B) ???? ???= y2 y1 X2 X1 = A 400m/min - 0m/min = 20min - 0min Speed m/min 20min 400m/min =20m/min/min B 400m/min Y2 = 0m/min Y1 = 0min X1 = 20min X2 =
All the accelerations Slope = rise run = speed time = y2 y1 X2 X1 = acceleration A) y2 y1 X2 X1 = 2400m/min 0m/min 15min 0??? 2400m 15??? = 160m/min/min = A Speed m/min B) y2 y1 X2 X1 = 400m/min 0m/min 20min 0??? 400m/min 20??? = 20m/min/min = B
Big Ideas The slope on a speed vs. time graph represents ACCELERATION. A flat line on a speed vs. time graph means you are not accelerating. (Moving at a constant speed)