Exploring Relationships Through Graphs

Learn how to analyze and relate two quantities using graphs, analyze data presented in tables and graphs, and sketch graphs representing various scenarios such as the movement of a model rocket or a playground swing. The visuals provided will help you understand how to interpret and draw graphs in different situations.

Download Presentation

Please find below an Image/Link to download the presentation.
The content on the website is provided AS IS for your information and personal use only. It may not be sold, licensed, or shared on other websites without obtaining consent from the author. Download presentation by click this link. If you encounter any issues during the download, it is possible that the publisher has removed the file from their server.
E N D
Presentation Transcript
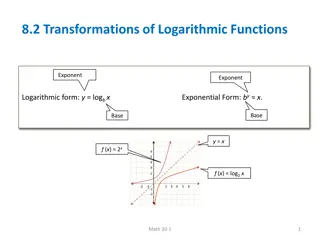
4-1 Using Graphs to Relate Two Quantities
Problem 2: Matching a Table and a Graph A band allowed fans to download its new video fro its Web site. The table show the total number of downloads after 1, 2, 3, and 4 days. Which graph could represent the data shown
The table shows the amount of sunscreen left in a can based on the number of times the sunscreen has been used. Which graph could represent the data shown in the table?
Problem 3: Sketching a Graph A model rocket rises quickly and then slows to a stop as its fuel burns out. It begins to fall quickly until the parachute opens, after which it falls slowly back to Earth. What sketch of a graph could represent the height of the rocket during its flight. Label each section.
Suppose you start to swing yourself on a playground swing. You move back and forth and swing higher in the air. Then you slowly swing to a stop. What sketch of a graph could represent how your height from the ground might change over time? Label each section.