Impact of Correlation on Human Reliability Analysis

Yusuke Takao, Satoshi Takeda, Takanori Kitada
Osaka University
I
m
p
a
c
t
o
f
C
o
r
r
e
l
a
t
i
o
n
b
e
t
w
e
e
n
P
e
r
f
o
r
m
a
n
c
e
S
h
a
p
i
n
g
F
a
c
t
o
r
s
o
n
T
h
e
i
r
M
u
l
t
i
p
l
i
e
r
s
PSAM 16
Y-233
O
u
t
l
i
n
e
1
*one of the
Human Reliability
Analysis
methods
B
a
c
k
g
r
o
u
n
d
A
b
o
u
t
8
0
%
o
f
a
c
c
i
d
e
n
t
s
t
h
a
t
o
c
c
u
r
a
t
N
u
c
l
e
a
r
P
o
w
e
r
P
l
a
n
t
(
N
P
P
s
)
a
r
e
c
a
u
s
e
d
b
y
h
u
m
a
n
e
r
r
o
r
1
)
.
H
u
m
a
n
R
e
l
i
a
b
i
l
i
t
y
A
n
a
l
y
s
i
s
(
H
R
A
)
q
u
a
n
t
i
t
a
t
i
v
e
l
y
i
d
e
n
t
i
f
i
e
s
a
n
d
a
n
a
l
y
z
e
s
t
h
e
c
a
u
s
e
s
o
f
h
u
m
a
n
e
r
r
o
r
b
y
c
a
l
c
u
l
a
t
i
n
g
H
u
m
a
n
E
r
r
o
r
P
o
s
s
i
b
i
l
i
t
y
(
H
E
P
)
.
S
P
A
R
-
H
i
s
o
n
e
o
f
H
R
A
m
e
t
h
o
d
s
a
n
d
i
t
c
a
l
l
s
f
a
c
t
o
r
s
t
h
a
t
m
a
y
i
n
f
l
u
e
n
c
e
h
u
m
a
n
a
c
t
i
v
i
t
i
e
s
P
e
r
f
o
r
m
a
n
c
e
S
h
a
p
i
n
g
F
a
c
t
o
r
s
(
P
S
F
s
)
.
2
1)
IAEA, (2013). Managing Human Performance to Improve Nuclear Facility Operation
P
u
r
p
o
s
e
G
e
n
e
r
a
l
l
y
,
P
S
F
s
a
r
e
t
r
e
a
t
e
d
a
s
i
n
d
e
p
e
n
d
e
n
t
b
u
t
P
S
F
s
h
a
v
e
b
e
e
n
r
e
p
o
r
t
e
d
t
o
h
a
v
e
c
o
r
r
e
l
a
t
i
o
n
s
2
,
3
)
.
The correlation coefficients of PSFs have been evaluated
from accident report in Korean NPPs
4)
.
3
2) Boring, R.L., How Many Performance Shaping Factors Are Necessary for Human Reliability Analysis? 2010, Idaho National Laboratory (INL).
3) Jianqiao Liu et al, Analysis of dependencies among performance shaping factors in human reliability analysis based on a system dynamics
approach. Reliability Engineering & System Safety 215(2021)107890
4) Jooyoung Park
et al, Inter-relationships between performance shaping factors for human reliability analysis of nuclear power plants. Nuclear Engineering and
Technology 52(2020)87-100
R
e
v
i
e
w
o
f
S
P
A
R
-
H
-
B
a
c
k
g
r
o
u
n
d
o
f
S
P
A
R
-
H
S
P
A
R
-
H
s
i
m
p
l
i
f
i
e
s
a
n
d
g
e
n
e
r
a
l
i
z
e
s
t
h
e
a
p
p
r
o
a
c
h
o
f
t
h
e
T
H
E
R
P
m
e
t
h
o
d
5
)
.
S
P
A
R
-
H
m
e
t
h
o
d
c
o
n
s
i
d
e
r
s
8
P
S
F
s
,
a
n
d
e
a
c
h
P
S
F
s
h
a
s
l
e
v
e
l
a
n
d
c
o
r
r
e
s
p
o
n
d
i
n
g
m
u
l
t
i
p
l
i
e
r
s
.
4
5) L. Boring, S. Blackman. “
The origins of the SPAR-H method’s performance shaping factor multipliers
.” 2007 IEEE 8th Human Factors and Power
Plants and HPRCT 13th Annual Meeting, pp. 177-184, (2007)
PSFs used in SPAR-H
:
Available time, Stress, Complexity,
Experience/Training, Procedures,
Ergonomics/HMI, Fitness for duty,
Work Processes
R
e
v
i
e
w
o
f
S
P
A
R
-
H
-
D
e
f
i
n
i
t
i
o
n
o
f
S
t
r
e
s
s
5
The degree of undesirable conditions or situation that prevent the
operator from completing a task easily
6)
.
S
t
r
e
s
s
i
n
c
l
u
d
e
s
m
e
n
t
a
l
s
t
r
e
s
s
,
e
x
c
e
s
s
i
v
e
w
o
r
k
l
o
a
d
a
n
d
p
h
y
s
i
c
a
l
s
t
r
e
s
s
.
S
t
r
e
s
s
o
r
s
s
u
c
h
a
s
n
o
i
s
e
a
n
d
p
o
o
r
v
e
n
t
i
l
a
t
i
o
n
m
a
y
c
a
u
s
e
m
e
n
t
a
l
o
r
p
h
y
s
i
c
a
l
s
t
r
e
s
s
t
o
o
p
e
r
a
t
o
r
.
S
t
r
e
s
s
6)
Idaho National Laboratory, The SPAR-H Human Reliability Analysis Method
R
e
v
i
e
w
o
f
S
P
A
R
-
H
-
D
e
f
i
n
i
t
i
o
n
o
f
C
o
m
p
l
e
x
i
t
y
6
D
i
f
f
i
c
u
l
t
y
o
f
p
e
r
f
o
r
m
i
n
g
a
t
a
s
k
i
n
t
h
e
g
i
v
e
n
s
i
t
u
a
t
i
o
n
.
S
P
A
R
-
H
c
o
n
s
i
d
e
r
s
1
4
c
o
n
t
r
i
b
u
t
i
n
g
f
a
c
t
o
r
s
t
o
c
o
m
p
l
e
x
i
t
y
,
p
a
r
a
l
l
e
l
t
a
s
k
s
,
m
e
n
t
a
l
c
a
l
c
u
l
a
t
i
o
n
r
e
q
u
i
r
e
d
,
e
t
c
.
C
o
m
p
l
e
x
i
t
y
A
l
o
t
o
f
p
a
r
a
l
l
e
l
t
a
s
k
s
m
a
y
c
a
u
s
e
s
t
r
e
s
s
o
n
o
p
e
r
a
t
o
r
.
7
There seem to be correlation between stress
and complexity.
T
h
e
c
o
e
f
f
i
c
i
e
n
t
s
b
e
t
w
e
e
n
s
t
r
e
s
s
a
n
d
c
o
m
p
l
e
x
i
t
y
i
s
0
.
5
8
8
4
)
,
w
h
i
c
h
i
s
r
e
l
a
t
i
v
e
l
y
s
t
r
o
n
g
.
Evaluate the impact of correlation on multiplier
using
s
tress
and
c
omplexity
.
R
e
v
i
e
w
o
f
S
P
A
R
-
H
-
D
e
f
i
n
i
t
i
o
n
o
f
S
t
r
e
s
s
a
n
d
C
o
m
p
l
e
x
i
t
y
4) Jooyoung Park
et al, Inter-relationships between performance shaping factors for human reliability analysis of nuclear power plants. Nuclear
Engineering and Technology 52(2020)87-100
M
e
t
h
o
d
T
h
e
i
n
f
l
u
e
n
c
e
o
f
c
o
m
p
l
e
x
i
t
y
i
s
r
e
d
u
c
e
d
b
y
t
h
e
i
n
f
l
u
e
n
c
e
o
f
s
t
r
e
s
s
o
n
t
h
e
H
E
P
.
8
The influence of
complexity
is strong
HEP increases 5 times
The influence of
stress
is
increased by considering
correlation.
Influence
of
complexity
considering correlation.
M
e
t
h
o
d
9
M
u
l
t
i
p
l
i
e
r
c
o
n
s
i
d
e
r
i
n
g
c
o
r
r
e
l
a
t
i
o
n
T
h
e
m
u
l
t
i
p
l
i
e
r
s
f
o
l
l
o
w
a
n
o
r
m
a
l
d
i
s
t
r
i
b
u
t
i
o
n
.
T
h
e
s
t
a
n
d
a
r
d
d
e
v
i
a
t
i
o
n
s
o
f
P
S
F
s
a
r
e
e
q
u
a
l
.
T
h
e
i
n
f
l
u
e
n
c
e
o
f
P
S
F
[
A
]
,
[
B
]
a
r
e
s
t
r
o
n
g
,
a
n
d
H
E
P
i
n
c
r
e
a
s
e
s
N
t
i
m
e
s
.
R
e
s
u
l
t
10
M
u
l
t
i
p
l
i
e
r
c
h
a
n
g
e
s
0
.
5
2
~
1
.
9
0
t
i
m
e
s
c
o
n
s
i
d
e
r
i
n
g
c
o
r
r
e
l
a
t
i
o
n
.
T
h
e
c
o
r
r
e
l
a
t
i
o
n
b
e
t
w
e
e
n
P
S
F
s
c
o
u
l
d
h
a
v
e
s
i
g
n
i
f
i
c
a
n
t
i
m
p
a
c
t
o
n
m
u
l
t
i
p
l
i
e
r
.
M’: Multiplier considering correlation, M’/M: the ratio of M to M’
D
i
s
c
u
s
s
i
o
n
1
11
Correlation coefficients:
0.588
T
h
e
c
h
a
n
g
e
o
f
t
h
e
m
u
l
t
i
p
l
i
e
r
i
s
s
m
a
l
l
e
v
e
n
w
h
e
n
w
e
c
o
n
s
i
d
e
r
t
h
e
u
n
c
e
r
t
a
i
n
t
y
i
n
c
o
r
r
e
l
a
t
i
o
n
c
o
e
f
f
i
c
i
e
n
t
s
.
D
i
s
c
u
s
s
i
o
n
2
12
D
i
s
c
u
s
s
i
o
n
2
13
T
h
e
d
i
f
f
e
r
e
n
c
e
o
f
i
m
p
a
c
t
o
n
m
u
l
t
i
p
l
i
e
r
b
e
t
w
e
e
n
d
i
s
t
r
i
b
u
t
i
o
n
s
i
s
s
m
a
l
l
.
M’: normal distribution, M”: log normal distribution
D
i
s
c
u
s
s
i
o
n
3
14
D
i
s
c
u
s
s
i
o
n
3
15
S
u
m
m
a
r
y
16
T
h
e
c
o
r
r
e
l
a
t
i
o
n
c
o
e
f
f
i
c
i
e
n
t
s
b
e
t
w
e
e
n
P
S
F
s
u
s
e
d
i
n
S
P
A
R
-
H
h
a
v
e
b
e
e
n
r
e
p
o
r
t
e
d
.
C
o
r
r
e
l
a
t
i
o
n
c
o
e
f
f
i
c
i
e
n
t
b
e
t
w
e
e
n
c
o
m
p
l
e
x
i
t
y
a
n
d
s
t
r
e
s
s
i
s
0
.
5
8
8
,
a
n
d
t
h
e
c
o
r
r
e
l
a
t
i
o
n
e
x
i
s
t
i
n
p
r
a
c
t
i
c
e
.
Evaluated the impact of correlation between
complexity
and
stress
on the multiplier.
T
h
e
m
u
l
t
i
p
l
i
e
r
s
c
h
a
n
g
e
f
r
o
m
0
.
5
2
t
o
1
.
9
0
t
i
m
e
s
c
o
n
s
i
d
e
r
i
n
g
c
o
r
r
e
l
a
t
i
o
n
.
T
h
e
c
o
r
r
e
l
a
t
i
o
n
b
e
t
w
e
e
n
P
S
F
s
c
o
u
l
d
h
a
v
e
s
i
g
n
i
f
i
c
a
n
t
i
m
p
a
c
t
o
n
t
h
e
m
u
l
t
i
p
l
i
e
r
a
n
d
H
E
P
.
17
F
u
t
u
r
e
t
a
s
k
s
C
a
l
c
u
l
a
t
e
t
h
e
c
o
r
r
e
l
a
t
i
o
n
c
o
e
f
f
i
c
i
e
n
t
s
u
s
i
n
g
a
c
c
i
d
e
n
t
r
e
p
o
r
t
a
t
N
P
P
s
i
n
J
a
p
a
n
.
Improve the formula of HEP considering correlation.
A
p
p
e
n
d
i
x
:
c
o
r
r
e
l
a
t
i
o
n
c
o
e
f
f
i
c
i
e
n
t
s
18
19
A
p
p
e
n
d
i
x
:
P
S
F
s
20
A
p
p
e
n
d
i
x
:
P
S
F
s
21
A
p
p
e
n
d
i
x
:
H
o
w
t
o
c
a
l
c
u
l
a
t
e
t
h
e
c
o
r
r
e
l
a
t
i
o
n
c
o
e
f
f
i
c
i
e
n
t
s
I
f
t
h
e
e
v
e
n
t
r
e
p
o
r
t
m
e
n
t
i
o
n
e
d
t
h
a
t
a
P
S
F
c
o
n
t
r
i
b
u
t
e
d
t
o
h
u
m
a
n
e
r
r
o
r
s
,
t
h
e
P
S
F
w
a
s
c
o
d
e
d
a
s
“
1
”
o
n
t
h
e
s
p
r
e
a
d
s
h
e
e
t
;
i
f
n
o
t
,
i
t
w
a
s
c
o
d
e
d
a
s
“
0
.
”
“
P
h
i
c
o
r
r
e
l
a
t
i
o
n
c
o
e
f
f
i
c
i
e
n
t
”
t
h
a
t
r
e
p
r
e
s
e
n
t
s
a
m
e
a
s
u
r
e
o
f
t
h
e
d
e
g
r
e
e
o
f
c
o
r
r
e
l
a
t
i
o
n
b
e
t
w
e
e
n
t
w
o
b
i
n
a
r
y
v
a
r
i
a
b
l
e
s
i
s
a
p
p
l
i
e
d
t
o
c
a
l
c
u
l
a
t
e
t
h
e
c
o
r
r
e
l
a
t
i
o
n
c
o
e
f
f
i
c
i
e
n
t
s
.
22
A
p
p
e
n
d
i
x
:
t
h
e
p
r
i
o
r
i
t
y
o
f
s
c
e
n
a
r
i
o
W
h
e
n
c
o
n
s
i
d
e
r
i
n
g
c
o
r
r
e
l
a
t
i
o
n
,
t
h
e
p
r
i
o
r
i
t
y
b
e
t
w
e
e
n
s
c
e
n
a
r
i
o
s
m
a
y
c
h
a
n
g
e
.
-60%
-25%
23
A
p
p
e
n
d
i
x
:
c
o
n
s
i
d
e
r
t
h
e
d
i
f
f
e
r
e
n
c
e
o
f
s
t
a
n
d
a
r
d
d
e
v
i
a
t
i
o
n
The number of multipliers set in the PSF is small, this
makes it difficult to set an appropriate standard
deviation.
Establish ratios of standard deviations between stress
and complexity.
24
A
p
p
e
n
d
i
x
:
C
o
r
r
e
l
a
t
i
o
n
b
e
t
w
e
e
n
2
o
r
m
o
r
e
P
S
F
s
The correlation exist in Stress.
T
h
e
i
n
f
l
u
e
n
c
e
o
f
a
l
l
P
S
F
s
a
r
e
s
t
r
o
n
g
,
a
n
d
H
E
P
i
n
c
r
e
a
s
e
s
N
t
i
m
e
s
.
Stress: PSF[S], Other PSFs: PSF[A]~[G]
Substitution
:
o
b
t
a
i
n
m
u
l
t
i
p
l
i
e
r
o
f
s
t
r
e
s
s
c
o
n
s
i
d
e
r
i
n
g
c
o
r
r
e
l
a
t
i
o
n
Thank you for the introduction.
I’m Yusuke Takao from Osaka University in Japan.
Today I’d like to talk about (title).
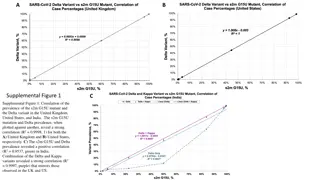
Understanding the impact of correlation between Performance Shaping Factors (PSFs) on their multipliers in the context of Human Reliability Analysis (HRA), particularly focusing on the SPAR-H method. The correlation among PSFs, such as stress, complexity, and training, is evaluated to determine how it influences human performance and error possibilities. This study aims to enhance the accuracy and effectiveness of HRA by considering the interrelationships between various factors affecting human activities in critical environments like Nuclear Power Plants.

Download Presentation

Please find below an Image/Link to download the presentation.
The content on the website is provided AS IS for your information and personal use only. It may not be sold, licensed, or shared on other websites without obtaining consent from the author.If you encounter any issues during the download, it is possible that the publisher has removed the file from their server.
You are allowed to download the files provided on this website for personal or commercial use, subject to the condition that they are used lawfully. All files are the property of their respective owners.
The content on the website is provided AS IS for your information and personal use only. It may not be sold, licensed, or shared on other websites without obtaining consent from the author.
E N D
Presentation Transcript
PSAM 16 Y-233 Impact of Correlation between Performance Shaping Factors on Their Multipliers Yusuke Takao, Satoshi Takeda, Takanori Kitada Osaka University
Outline 1 Background & Purpose *one of the Human Reliability Analysis methods Review of SPAR-H* Background of SPAR-H, definition of complexity and stress Method How to calculate multiplier considering correlation Result The impact of correlation between PSFs on multiplier Discussion Summary
Background 2 About 80% of accidents that occur at Nuclear Power Plant (NPPs) are caused by human error1). Human Reliability Analysis (HRA) quantitatively identifies and analyzes the causes of human error by calculating Human Error Possibility (HEP). SPAR-H is one of HRA methods and it calls factors that may influence human activities Performance Shaping Factors (PSFs). 1) IAEA, (2013). Managing Human Performance to Improve Nuclear Facility Operation
Purpose 3 Generally, PSFs are treated as independent but PSFs have been reported to have correlations2,3). The correlation coefficients of PSFs have been evaluated from accident report in Korean NPPs4). Purpose To evaluate the impact of the correlation on the multiplier. 2) Boring, R.L., How Many Performance Shaping Factors Are Necessary for Human Reliability Analysis? 2010, Idaho National Laboratory (INL). 3) Jianqiao Liu et al, Analysis of dependencies among performance shaping factors in human reliability analysis based on a system dynamics approach. Reliability Engineering & System Safety 215(2021)107890 4) Jooyoung Park et al, Inter-relationships between performance shaping factors for human reliability analysis of nuclear power plants. Nuclear Engineering and Technology 52(2020)87-100
Review of SPAR-H -Background of SPAR-H 4 SPAR-H simplifies and generalizes the approach of the THERP method5). SPAR-H method considers 8 PSFs, and each PSFs has level and corresponding multipliers. PSFs used in SPAR-H Available time, Stress, Complexity, Experience/Training, Procedures, Ergonomics/HMI, Fitness for duty, Work Processes Increase HEP Decrease HEP 5) L. Boring, S. Blackman. The origins of the SPAR-H method s performance shaping factor multipliers. 2007 IEEE 8th Human Factors and Power Plants and HPRCT 13th Annual Meeting, pp. 177-184, (2007)
Review of SPAR-H -Definition of Stress Stress 5 The degree of undesirable conditions or situation that prevent the operator from completing a task easily6). Stress includes mental stress, excessive workload and physical stress. Stressors such as noise and poor ventilation may cause mental or physical stress to operator. Level for Stress Explanation Multiplier Regrade the performance of operators. Stressor suddenly happens and stressful situation lasts long time. Lower than extreme level. Conductive to good performance 5 Extreme 2 1 High Nominal 6) Idaho National Laboratory, The SPAR-H Human Reliability Analysis Method
Review of SPAR-H -Definition of Complexity Complexity 6 Difficulty of performing a task in the given situation. SPAR-H considers 14 contributing factors to complexity, parallel tasks, mental calculation required, etc. A lot of parallel tasks may cause stress on operator. Level for Complexity Highly complex Moderately complex Explanation Multiplier Very difficult to perform a task. Many variables are involved. Somewhat difficult to perform. Several variables are involved. Not difficult to perform. Single or few variables are involved. Diagnosis becomes greatly simplified. There are much times to diagnosis . 5 2 1 Nominal Obvious diagnosis 0.1
Review of SPAR-H -Definition of Stress and Complexity 7 There seem to be correlation between stress and complexity. The coefficients between stress and complexity is 0.5884), which is relatively strong. Evaluate the impact of correlation on multiplier using stress and complexity. 4) Jooyoung Park et al, Inter-relationships between performance shaping factors for human reliability analysis of nuclear power plants. Nuclear Engineering and Technology 52(2020)87-100
Method 8 Premise There is a correlation in the large amount of empirical data used to calculate the multiplier for PSFs. The influence of complexity is strong HEP increases 5 times The influence of stress is increased by considering correlation. 100% 100% 80% 80% 60% 60% 40% 40% Influence of complexity considering correlation. 20% 20% 0% 0% independent independent correlation complexity complexity stress stress The influence of complexity is reduced by the influence of stress on the HEP.
Method 9 The multipliers follow a normal distribution. The standard deviations of PSFs are equal. The influence of PSF[A],[B] are strong, and HEP increases N times. Conditional expectation ,?? satisfies ?? ?? = ? = ? ????= ?? = ??+ ? ?? ?? ????= ?? ?? ??,??: expected value (=1) ??, ??: standard deviation ?: correlation coefficient ? ??+ ??? ?? ? ?= ? ? + Multiplier considering correlation
Result 10 M : Multiplier considering correlation, M /M: the ratio of M to M M 5 2 1 0.1 M 2.59 1.53 1 0.19 M /M 0.52 0.77 1 1.90 Multiplier changes 0.52 ~ 1.90 times considering correlation. The correlation between PSFs could have significant impact on multiplier.
Discussion1 11 Discussion The multiplier considering uncertainty of correlation coefficients. 5 Correlation coefficients: 0.588 4 3 Multiplier 2 1 0 0 0.2 0.4 0.6 0.8 1 Correlation coefficients The change of the multiplier is small even when we consider the uncertainty in correlation coefficients.
Discussion2 12 Problem When the multipliers follow a normal distribution, the multiplier take negative values. But multipliers don t take negative value. Discussion Assume that multiplier follow a log normal distribution Evaluate the impact on the multiplier considering different distributions.
Discussion2 13 Comparison of calculation Log normal distribution Normal distribution ? ? ??? ? ??? ?+??? ??? ?? ? + ? ?? ? = ? ?? = ? ? ? ?? ?? M : normal distribution, M : log normal distribution Multiplier 5 2 1 0.1 M 2.59 1.53 1 0.19 M 2.61 1.47 1 0.22 M /M 1.01 0.96 1 1.16 The difference of impact on multiplier between distributions is small.
Discussion3 14 Discussion Evaluate the impact of correlation on HEP. Method Consider a situation that a task is diagnosis part. The base HEP (NHEP) is 0.01. Modify the NHEP considering 8 PSFs. HEP= NHEP (Multiplier
Discussion3 15 Situation Complexity and stress affect on HEP and other PSFs are nominal. Multiplier PSF Considering correlation 1.53 2.59 1 0.01 0.04 Original Complexity Stress Other PSFs NHEP HEP 2 5 1 0.01 0.10 HEP is about -60% considering correlation.
Summary 16 The correlation coefficients between PSFs used in SPAR-H have been reported. Correlation coefficient between complexity and stress is 0.588, and the correlation exist in practice. Evaluated the impact of correlation between complexity and stress on the multiplier. The multipliers change from 0.52 to 1.90 times considering correlation. The correlation between PSFs could have significant impact on the multiplier and HEP.
Future tasks 17 Calculate the correlation coefficients using accident report at NPPs in Japan. Improve the formula of HEP considering correlation.
Appendix: correlation coefficients 18 Ergonomi cs/HMI Available Time Procedures Work Processe s Complexity Experience / Training Stress/ Stressors Fitness For duty R = 1.0 Ergonomics / HMI Available time 0.283 1.0 0.367 0.313 1.0 Procedures 0.323 0.467 0.604 1.0 Work processes 0.376 0.524 0.413 0.526 1.0 Complexity 0.418 0.350 0.646 0.475 0.458 1.0 Experience/ Training 0.127 0.651 0.288 0.379 0.588 0.379 1.0 Stress/Stres sors -0.046 0.297 0.178 0.137 0.417 0.201 0.593 1.0 Fitness for duty
Appendix: PSFs 19 Multiplier Diagnosis HEP=1.0 10 1 0.1 0.01 5 2 1 5 2 1 0.1 10 1 0.5 Multiplier Action HEP=1.0 10 1 0.1 0.01 5 2 1 5 2 1 - 3 1 0.5 PSF PSF Level Inadequate time Barely adequate time Nominal time Extra time Expansive time Extreme High Nominal Highly complex Moderately complex Nominal Obvious diagnosis Low Nominal High Available time Stress Complexity Experience/ Training
Appendix: PSFs 20 Multiplier Diagnosis 50 20 5 1 Multiplier Action 50 20 5 1 PSF PSF Level Not available Incomplete Available, but poor Nominal Diagnostic/symptom oriented Missing/Misleading Poor Nominal Good Unfit Degraded Fitness Nominal Poor Nominal Good Procedures 0.5 50 10 1 0.5 50 10 1 0.5 Ergonomics/HMI HEP=1.0 5 1 2 1 0.8 HEP=1.0 5 1 5 1 0.5 Fitness for duty Work Processes
Appendix: How to calculate the correlation coefficients If the event report mentioned that a PSF contributed to human errors, the PSF was coded as 1 on the spreadsheet; if not, it was coded as 0. 21 Phi correlation coefficient that represents a measure of the degree of correlation between two binary variables is applied to calculate the correlation coefficients. Available time (influence) Available time (not influence) PSFs Total Stress (influence) Stress (not influence) Total X 11-X 11 10-X 43+X 53 10 54 64 =? 43 + ? 11 ? 10 ? 11 53 10 54 64? 110 11 53 10 54= ?.??? =
Appendix: the priority of scenario 22 0.03 scenario 1 scenario 2 0.02 0.01 0 independent correlation -60% -25% When considering correlation, the priority between scenarios may change.
Appendix: consider the difference of standard deviation 23 The number of multipliers set in the PSF is small, this makes it difficult to set an appropriate standard deviation. Establish ratios of standard deviations between stress and complexity. PSF PSF : Stress 2:1 ?:? 2:1 10:1 10:1 1:1 1:1 Available time Complexity Experience/Training Procedures Ergonomics/HMI Fitness for duty Work processes
Appendix: Correlation between 2 or more PSFs 24 The correlation exist in Stress. The influence of all PSFs are strong, and HEP increases N times. Stress: PSF[S], Other PSFs: PSF[A]~[G] Situation Substitution: obtain multiplier of stress considering correlation ?? ?? ?? ?? ?? ?? ?? ?? = ? Conditional expectation = ? ????= ?? = ??+ ??? ?? ?? ?? (? = ?~?) ??