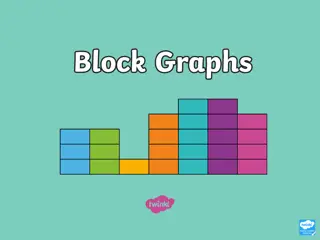
Exploring Various Types of Graphs in Statistics Education

Delve into the world of data visualization with slow reveal graphs, column graphs, pictographs, dot plots, divided bar graphs, sector graphs, line graphs, and stem-and-leaf plots. Engage in observations and wonderings to enhance statistical comprehension and analytical skills.

Download Presentation

Please find below an Image/Link to download the presentation.
The content on the website is provided AS IS for your information and personal use only. It may not be sold, licensed, or shared on other websites without obtaining consent from the author. Download presentation by click this link. If you encounter any issues during the download, it is possible that the publisher has removed the file from their server.
E N D
Presentation Transcript
Slow reveal graphs What do you notice? What do you wonder?
Column graph What do you notice? What do you wonder? https://games.abc.net.au/education/statistics-game/index.htm#/ 2
Pictograph What do you notice? What do you wonder? = 20 games 3
Dot plot What do you notice? What do you wonder? 4
Divided bar graph What do you notice? What do you wonder? https://games.abc.net.au/education/statistics-game/index.htm#/ 5
Sector graph What do you notice? What do you wonder? 6
Line graph What do you notice? What do you wonder? https://games.abc.net.au/education/statistics-game/index.htm#/ 7
Stem and leaf plot What do you notice? What do you wonder? Long jump results for U15 boys at Plainville High School 2 | 3 means 2.3 8