Understanding Data and Graphs: Variables Analysis

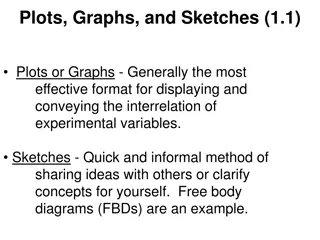
Practice interpreting data and graphs related to variables such as independent and dependent variables. Analyze circle, line, and bar graphs, data tables, and charts to understand concepts like time allocation, car trip details, demand and price relationship, atomic element properties, mass-force correlation, and temperature reactions over time.

Download Presentation

Please find below an Image/Link to download the presentation.
The content on the website is provided AS IS for your information and personal use only. It may not be sold, licensed, or shared on other websites without obtaining consent from the author. Download presentation by click this link. If you encounter any issues during the download, it is possible that the publisher has removed the file from their server.
E N D
Presentation Transcript
PRACTICE INTERPRETING DATA AND GRAPHS (VARIABLES)
1. The circle graph represents the typical day of a teenager. a. What is the Independent Variable? b. What is the Dependent Variable? c. What percent of the day is spent watching TV? d. What activity takes up the least amount of time? e. What activity takes up a quarter of the day? f. What two activities take up 50% of the day? g. What two activities take up 25% of the day? h. Create a data table for the pie chart/circle graph.
2. The line graph represents a trip by car.: a. What is the independent variable? b. What is the dependent variable? c. Predict the motion of the car between hours 5 and 12. d. How many miles were traveled in the first two hours? e. Which line represents the fastest speed?
3. Answer these questions about the bar graph above: a.What variable is on the y-axis of this graph? b. What variable is on the x-axis of this graph? c. What is the demand when the price is 5$ per bushel?
Atomic Number of Elements Ionization Energy (volts) 2 24 4 9 6 11 8 13.5 10 21. 4. Answer these questions about the data table: a. What is the independent variable on this table? b. What is the dependent variable on this table? c. How many elements are represented on the table? d. Which element has the highest ionization energy? e. Create a line graph using this data. (remember to use your tip sheet label axis, use appropriate scale, use ruler)
Years Mass (g) 2 30 4 60 6 ? 8 120 10 150 5. Answer the questions using the data table: a. Fill in the missing information. b. What is the independent variable? c. What is the dependent variable? d. What would the dependent variable be if the independent variable was 14? e. What type of graph would you create from this data table?
Mass (g) of Object Force (N) 6 3 12 4.5 18 6 22 7 6. Answer the questions using the data table: a. If the force was 5N what would the mass of the object be? b. If the mass of the object is 30g, how much force would be needed? c. What type of graph would you create from this data table? d. What is the independent variable? e. What is the dependent variable?
Reaction Temperature in Minutes 45 40 35 30 Temperature (Celsius) 25 20 15 10 5 0 5 10 15 20 25 7. Answer the questions using Reaction Temperatures: a. What would be the temperature if the reaction was continued until minute 30? b. What should be the label on the X-axis? c. Finish the conclusion statement: As time ____________, temperature ____________.
Plant height per Week 16 14 12 Length (meters) 10 8 6 4 2 0 1 2 3 4 5 8. Answer the questions using Plant Height: a. What would be the length if the height were taken of the plant in week 6? b. What should be the label on the X-axis? c. Finish the conclusion statement: As time ____________, length ____________.
ANSWERS 1. The graph at the right represents the typical day of a teenager. Answer these questions: a.What is the Independent Variable? Activities b.What is the Dependent Variable? % of Each Activity c.What percent of the day is spent watching TV? 13% d.What activity takes up the least amount of time? Studying e.What activity takes up a quarter of the day? Going to School f.What two activities take up 50% of the day? Sleep & Phone g.What two activities take up 25% of the day? Phone & Eating h.Create a data table for the pie chart/circle graph.
ANSWERS Answer these questions about the graph on the right: a.What is the independent variable? Hours b.What is the dependent variable? Miles c.Predict the motion of the car between hours 5 and 12. Setting still d.How many miles were traveled in the first two hours of the trip? 20-25 e.Which line represents the fastest speed? Line D-E
ANSWERS Answer these questions about the graph at the right: a.What variable is on the y-axis of this graph? Quantity Demand b.What variable is on the x-axis of this graph? Price per Bushel a.What is the deman when the price is 5$ per bushel? $10/week
ANSWERS Ionization Energy (volts) 24 9 11 13.5 21. Atomic Number of Elements 2 4 6 8 10 Answer these questions about the data table: What is the independent variable on this table? Atomic # of Elements What is the dependent variable on this table? Ionization Energy How many elements are represented on the table? 5 Which element has the highest ionization energy? 2 Create a line graph using this data. (remember to use your tip sheet label axis, use appropriate scale, use ruler)
ANSWERS Years Mass (g) 2 30 4 60 6 ? 8 120 10 150 Fill in the missing information. 90 What is the independent variable? Years What is the dependent variable? Mass What would the dependent variable be if the independent variable was 14? 210g What type of graph would you create from this data table? Line graph
ANSWERS Mass (g) of Object 6 12 18 22 Force (N) 3 4.5 6 7 What is the independent variable? Mass of Object (g) What is the dependent variable? Force (N) If the force was 5N what would the mass of the object be? 14g If the mass of the object is 30g, how much force would be needed? 9N What type of graph would you create from this data table? Bar or line Graph
ANSWERS Reaction Temperature in Minutes 50 Temperature 40 (Celsius) 30 20 10 0 5 10 15 20 25 What would be the temperature if the reaction was continued until minute 30? 45 45- -50 50 What should be the label on the X-axis? Time (minutes) Finish the conclusion statement: As time increases increases__, temperature _ increases increases __.
ANSWERS Plant height per Week 16 14 12 Length (meters) 10 8 6 4 2 0 1 2 3 4 5 What would be the length if the height were taken of the plant in week 6? 17-20 What should be the label on the X-axis? Week Finish the conclusion statement: As time _ increases __, length _ increases __


 of Object")