Understanding Correlation in Two-Variable Data Analysis


Analyzing Two-Variable Data
Lesson 2.3
Correlation
2


Estimate the correlation between two quantitative variables from a
scatterplot.
Interpret the correlation.
Distinguish correlation from causation.
Correlation


Correlation
In the previous lesson, we used direction, form, and strength to
describe the association between two quantitative variables.
T
o
q
u
a
n
t
i
f
y
t
h
e
s
t
r
e
n
g
t
h
o
f
a
l
i
n
e
a
r
r
e
l
a
t
i
o
n
s
h
i
p
b
e
t
w
e
e
n
t
w
o
q
u
a
n
t
i
t
a
t
i
v
e
v
a
r
i
a
b
l
e
s
,
w
e
u
s
e
t
h
e
c
o
r
r
e
l
a
t
i
o
n
r
.
Correlation
Here are six scatterplots and their corresponding correlations.
H
o
w
m
u
c
h
d
o
c
a
r
s
a
n
d
h
o
u
s
e
s
c
o
s
t
?
E
s
t
i
m
a
t
i
n
g
c
o
r
r
e
l
a
t
i
o
n
P
R
O
B
L
E
M
:
F
o
r
e
a
c
h
o
f
t
h
e
f
o
l
l
o
w
i
n
g
r
e
l
a
t
i
o
n
s
h
i
p
s
,
i
s
r
>
0
o
r
r
<
0
?
C
l
o
s
e
r
t
o
r
=
0
o
r
r
=
±
1
?
E
x
p
l
a
i
n
y
o
u
r
r
e
a
s
o
n
i
n
g
.
a)
The scatterplot below shows data on the mileage and price of 41 Dodge
Chargers advertised on
http://autos.yahoo.com
.
B
e
c
a
u
s
e
t
h
e
r
e
l
a
t
i
o
n
s
h
i
p
b
e
t
w
e
e
n
m
i
l
e
s
d
r
i
v
e
n
a
n
d
p
r
i
c
e
i
s
n
e
g
a
t
i
v
e
,
r
<
0
.
A
l
s
o
,
r
i
s
c
l
o
s
e
r
t
o
–
1
t
h
a
n
0
b
e
c
a
u
s
e
t
h
e
r
e
l
a
t
i
o
n
s
h
i
p
i
s
s
t
r
o
n
g
.
T
h
e
r
e
i
s
n
’
t
m
u
c
h
s
c
a
t
t
e
r
f
r
o
m
t
h
e
l
i
n
e
a
r
p
a
t
t
e
r
n
.
H
o
w
m
u
c
h
d
o
c
a
r
s
a
n
d
h
o
u
s
e
s
c
o
s
t
?
E
s
t
i
m
a
t
i
n
g
c
o
r
r
e
l
a
t
i
o
n
P
R
O
B
L
E
M
:
F
o
r
e
a
c
h
o
f
t
h
e
f
o
l
l
o
w
i
n
g
r
e
l
a
t
i
o
n
s
h
i
p
s
,
i
s
r
>
0
o
r
r
<
0
?
C
l
o
s
e
r
t
o
r
=
0
o
r
r
=
±
1
?
E
x
p
l
a
i
n
y
o
u
r
r
e
a
s
o
n
i
n
g
.
b)
A scatterplot of assessed value versus living space for a sample of houses
near Pittsburgh, Pennsylvania, is shown below. The data were collected by
statistics teacher Michael Lacey.
B
e
c
a
u
s
e
t
h
e
r
e
l
a
t
i
o
n
s
h
i
p
b
e
t
w
e
e
n
l
i
v
i
n
g
s
p
a
c
e
a
n
d
a
s
s
e
s
s
e
d
v
a
l
u
e
i
s
p
o
s
i
t
i
v
e
,
r
>
0
.
I
t
i
s
n
o
t
c
l
e
a
r
w
h
e
t
h
e
r
t
h
e
v
a
l
u
e
o
f
r
i
s
c
l
o
s
e
r
t
o
0
o
r
1
b
e
c
a
u
s
e
t
h
e
r
e
l
a
t
i
o
n
s
h
i
p
i
s
m
o
d
e
r
a
t
e
.
T
h
e
v
a
l
u
e
o
f
r
i
s
p
r
o
b
a
b
l
y
a
r
o
u
n
d
0
.
5
.
W
e
i
g
h
t
t
r
a
i
n
i
n
g
,
a
s
e
c
o
n
d
r
e
p
?
I
n
t
e
r
p
r
e
t
i
n
g
t
h
e
c
o
r
r
e
l
a
t
i
o
n
P
R
O
B
L
E
M
:
T
h
e
s
c
a
t
t
e
r
p
l
o
t
b
e
l
o
w
s
h
o
w
s
t
h
e
r
e
l
a
t
i
o
n
s
h
i
p
b
e
t
w
e
e
n
t
h
e
a
m
o
u
n
t
o
f
w
e
i
g
h
t
s
t
u
d
e
n
t
s
f
r
o
m
a
w
e
i
g
h
t
t
r
a
i
n
i
n
g
c
l
a
s
s
c
a
n
s
q
u
a
t
a
n
d
b
e
n
c
h
p
r
e
s
s
f
r
o
m
t
h
e
e
x
a
m
p
l
e
i
n
L
e
s
s
o
n
2
.
2
.
T
h
e
c
o
r
r
e
l
a
t
i
o
n
i
s
r
=
0
.
9
3
9
.
I
n
t
e
r
p
r
e
t
t
h
i
s
v
a
l
u
e
i
n
c
o
n
t
e
x
t
.
T
h
e
c
o
r
r
e
l
a
t
i
o
n
o
f
0
.
9
3
9
i
n
d
i
c
a
t
e
s
t
h
a
t
t
h
e
l
i
n
e
a
r
r
e
l
a
t
i
o
n
s
h
i
p
b
e
t
w
e
e
n
t
h
e
s
q
u
a
t
w
e
i
g
h
t
a
n
d
b
e
n
c
h
p
r
e
s
s
w
e
i
g
h
t
f
o
r
t
h
e
s
e
s
t
u
d
e
n
t
s
i
s
s
t
r
o
n
g
a
n
d
p
o
s
i
t
i
v
e
.
Correlation
C
a
u
t
i
o
n
!
A
c
o
r
r
e
l
a
t
i
o
n
c
l
o
s
e
t
o
1
o
r
–
1
d
o
e
s
n
’
t
n
e
c
e
s
s
a
r
i
l
y
m
e
a
n
a
n
a
s
s
o
c
i
a
t
i
o
n
i
s
l
i
n
e
a
r
.
F
o
r
e
x
a
m
p
l
e
,
t
h
e
s
c
a
t
t
e
r
p
l
o
t
b
e
l
o
w
i
s
c
l
e
a
r
l
y
n
o
n
l
i
n
e
a
r
,
y
e
t
t
h
e
c
o
r
r
e
l
a
t
i
o
n
i
s
r
=
0
.
9
3
.
Correlation
alone
doesn’t provide any information about form. To
determine the form of an association, you must look at a scatterplot.
Correlation
W
h
i
l
e
t
h
e
c
o
r
r
e
l
a
t
i
o
n
i
s
a
g
o
o
d
w
a
y
t
o
m
e
a
s
u
r
e
t
h
e
s
t
r
e
n
g
t
h
a
n
d
d
i
r
e
c
t
i
o
n
o
f
a
l
i
n
e
a
r
r
e
l
a
t
i
o
n
s
h
i
p
,
i
t
h
a
s
l
i
m
i
t
a
t
i
o
n
s
.
M
o
s
t
i
m
p
o
r
t
a
n
t
l
y
,
c
o
r
r
e
l
a
t
i
o
n
d
o
e
s
n
’
t
i
m
p
l
y
c
a
u
s
a
t
i
o
n
.
In many cases, two variables might have a strong correlation, but
changes in one variable are very unlikely to cause changes in the
other variable.
D
o
p
e
t
s
c
a
u
s
e
u
s
t
o
e
a
t
c
h
e
e
s
e
?
C
o
r
r
e
l
a
t
i
o
n
a
n
d
c
a
u
s
a
t
i
o
n
P
R
O
B
L
E
M
:
A
c
c
o
r
d
i
n
g
t
o
t
h
e
w
e
b
s
i
t
e
h
t
t
p
:
/
/
w
w
w
.
t
y
l
e
r
v
i
g
e
n
.
c
o
m
/
,
t
h
e
c
o
r
r
e
l
a
t
i
o
n
b
e
t
w
e
e
n
p
e
r
c
a
p
i
t
a
c
o
n
s
u
m
p
t
i
o
n
o
f
m
o
z
z
a
r
e
l
l
a
c
h
e
e
s
e
a
n
d
m
o
n
e
y
s
p
e
n
t
o
n
p
e
t
s
i
n
a
r
e
c
e
n
t
d
e
c
a
d
e
i
s
r
=
0
.
9
3
.
D
o
e
s
t
h
e
s
t
r
o
n
g
c
o
r
r
e
l
a
t
i
o
n
b
e
t
w
e
e
n
t
h
e
s
e
t
w
o
v
a
r
i
a
b
l
e
s
s
u
g
g
e
s
t
t
h
a
t
s
p
e
n
d
i
n
g
m
o
r
e
m
o
n
e
y
o
n
p
e
t
s
c
a
u
s
e
s
p
e
o
p
l
e
t
o
c
o
n
s
u
m
e
m
o
r
e
c
h
e
e
s
e
?
E
x
p
l
a
i
n
.
P
r
o
b
a
b
l
y
n
o
t
.
A
l
t
h
o
u
g
h
t
h
e
r
e
i
s
a
s
t
r
o
n
g
,
p
o
s
i
t
i
v
e
c
o
r
r
e
l
a
t
i
o
n
,
a
n
i
n
c
r
e
a
s
e
i
n
m
o
n
e
y
s
p
e
n
t
o
n
p
e
t
s
i
s
n
o
t
l
i
k
e
l
y
t
o
c
a
u
s
e
p
e
o
p
l
e
t
o
c
o
n
s
u
m
e
m
o
r
e
m
o
z
z
a
r
e
l
l
a
c
h
e
e
s
e
.
I
t
i
s
l
i
k
e
l
y
t
h
a
t
b
o
t
h
o
f
t
h
e
s
e
v
a
r
i
a
b
l
e
s
a
r
e
g
e
t
t
i
n
g
l
a
r
g
e
r
o
v
e
r
t
i
m
e
,
w
h
i
c
h
e
x
p
l
a
i
n
s
t
h
e
a
s
s
o
c
i
a
t
i
o
n
.
L
E
S
S
O
N
A
P
P
2
.
3
Most people love chocolate for its great taste. But does it also make
you smarter? A scatterplot like this one recently appeared in the New
England Journal of Medicine. The explanatory variable is the chocolate
consumption per person for a sample of countries. The response
variable is the number of Nobel Prizes per 10 million residents of that
country.
I
f
I
e
a
t
m
o
r
e
c
h
o
c
o
l
a
t
e
,
w
i
l
l
I
w
i
n
a
N
o
b
e
l
p
r
i
z
e
?
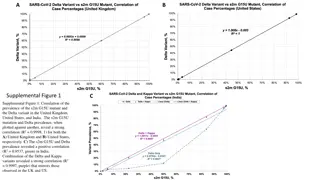
1.
Interpret the correlation of
r
=
0.791.
2.
If people in the United States
started eating more chocolate,
can we expect more Nobel
Prizes to be awarded to
residents of the United
States? Explain.
L
E
S
S
O
N
A
P
P
2
.
3
I
f
I
e
a
t
m
o
r
e
c
h
o
c
o
l
a
t
e
,
w
i
l
l
I
w
i
n
a
N
o
b
e
l
p
r
i
z
e
?
1.
Interpret the correlation of
r
= 0.791.
2.
If people in the United States started eating more chocolate, can we expect
more Nobel Prizes to be awarded to residents of the United States? Explain.
Estimate the correlation between two quantitative variables from a
scatterplot.
Interpret the correlation.
Distinguish correlation from causation.
Correlation
Exploring the concept of correlation in analyzing two-variable data, this lesson delves into estimating the correlation between quantitative variables, interpreting the correlation, and distinguishing between correlation and causation. Through scatterplots and examples, the strength and direction of a linear relationship are quantified using the correlation coefficient 'r,' which ranges between -1 and 1. Understanding how to estimate correlation by assessing scatter and linearity is crucial in statistical analysis.

Download Presentation

Please find below an Image/Link to download the presentation.
The content on the website is provided AS IS for your information and personal use only. It may not be sold, licensed, or shared on other websites without obtaining consent from the author. Download presentation by click this link. If you encounter any issues during the download, it is possible that the publisher has removed the file from their server.
E N D
Presentation Transcript
Analyzing Two-Variable Data Lesson 2.3 Correlation Statistics and Probability with Applications, 3rdEdition Starnes & Tabor Bedford Freeman Worth Publishers
Correlation Learning Targets After this lesson, you should be able to: Estimate the correlation between two quantitative variables from a scatterplot. Interpret the correlation. Distinguish correlation from causation. Statistics and Probability with Applications, 3rdEdition 2 2
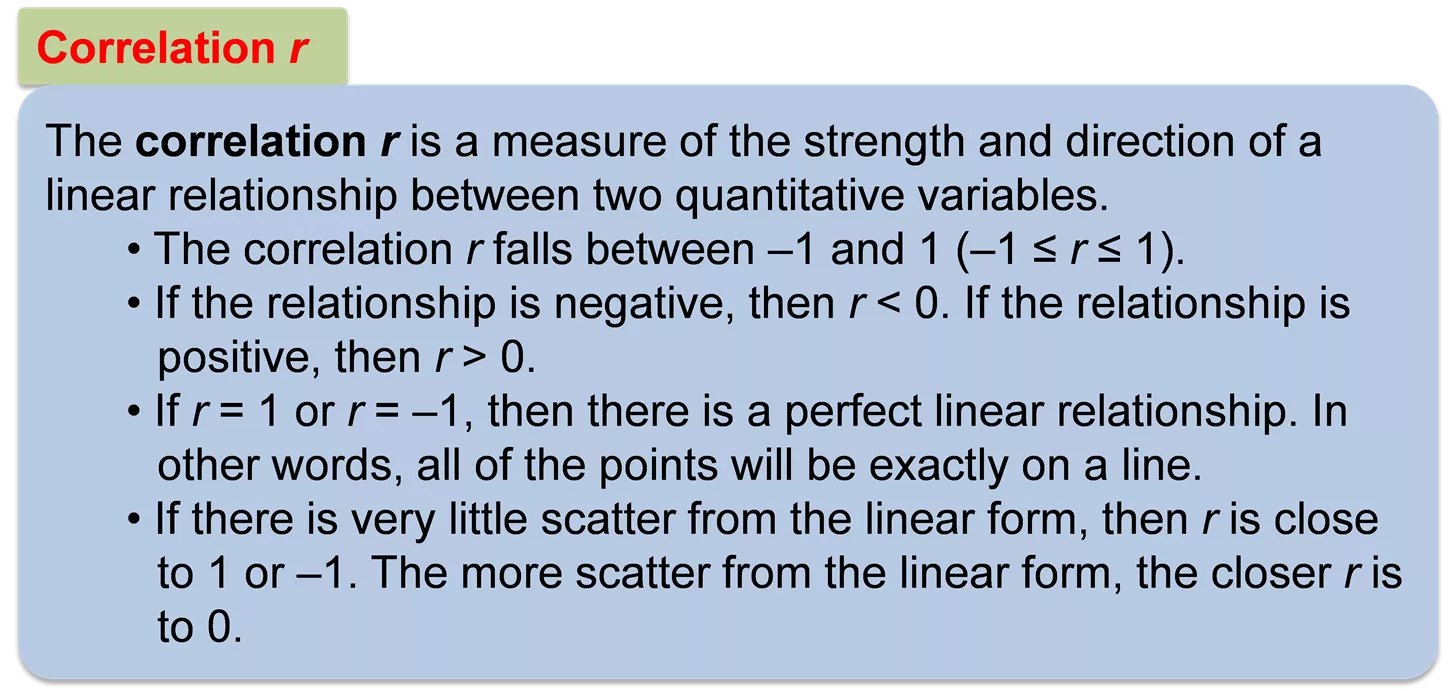
Correlation In the previous lesson, we used direction, form, and strength to describe the association between two quantitative variables. To quantify the strength of a linear relationship between two quantitative variables, we use the correlation r. Correlation r The correlation r is a measure of the strength and direction of a linear relationship between two quantitative variables. The correlation r falls between 1 and 1 ( 1 r 1). If the relationship is negative, then r < 0. If the relationship is positive, then r > 0. If r = 1 or r = 1, then there is a perfect linear relationship. In other words, all of the points will be exactly on a line. If there is very little scatter from the linear form, then r is close to 1 or 1. The more scatter from the linear form, the closer r is to 0. Statistics and Probability with Applications, 3rdEdition 3 3
Correlation Here are six scatterplots and their corresponding correlations. Statistics and Probability with Applications, 3rd Edition 4 4
How much do cars and houses cost? How much do cars and houses cost? Estimating correlation Estimating correlation PROBLEM: For each of the following relationships, is r > 0 or r < 0? Closer to r = 0 or r = 1? Explain your reasoning. a) The scatterplot below shows data on the mileage and price of 41 Dodge Chargers advertised on http://autos.yahoo.com. 35000 30000 25000 Price (dollars) 20000 15000 10000 0 20000 40000 60000 80000 100000 120000 Miles driven Because the relationship between miles driven and price is negative, r < 0. Also, r is closer to 1 than 0 because the relationship is strong. There isn t much scatter from the linear pattern. Statistics and Probability with Applications, 3rd Edition 5 5
How much do cars and houses cost? How much do cars and houses cost? Estimating correlation Estimating correlation PROBLEM: For each of the following relationships, is r > 0 or r < 0? Closer to r = 0 or r = 1? Explain your reasoning. b) A scatterplot of assessed value versus living space for a sample of houses near Pittsburgh, Pennsylvania, is shown below. The data were collected by statistics teacher Michael Lacey. Because the relationship between living space and assessed value is positive, r > 0. It is not clear whether the value of r is closer to 0 or 1 because the relationship is moderate. The value of r is probably around 0.5. Statistics and Probability with Applications, 3rd Edition 6 6
Weight training, a second rep? Weight training, a second rep? Interpreting the correlation Interpreting the correlation PROBLEM: The scatterplot below shows the relationship between the amount of weight students from a weight training class can squat and bench press from the example in Lesson 2.2. The correlation is r = 0.939. Interpret this value in context. 450 400 350 Squat weight (pounds) 300 250 200 150 100 100 120 140 160 180 200 Bench press weight (pounds) The correlation of 0.939 indicates that the linear relationship between the squat weight and bench press weight for these students is strong and positive. Statistics and Probability with Applications, 3rd Edition 7 7
Correlation Caution! A correlation close to 1 or 1 doesn t necessarily mean an association is linear. For example, the scatterplot below is clearly nonlinear, yet the correlation is r = 0.93. Correlation alonedoesn t provide any information about form. To determine the form of an association, you must look at a scatterplot. Statistics and Probability with Applications, 3rd Edition 8 8
Correlation While the correlation is a good way to measure the strength and direction of a linear relationship, it has limitations. Most importantly, correlation doesn t imply causation. In many cases, two variables might have a strong correlation, but changes in one variable are very unlikely to cause changes in the other variable. Statistics and Probability with Applications, 3rd Edition 9 9
Do pets cause us to eat cheese? Do pets cause us to eat cheese? Correlation and causation Correlation and causation PROBLEM: According to the website http://www.tylervigen.com/, the correlation between per capita consumption of mozzarella cheese and money spent on pets in a recent decade is r = 0.93. Does the strong correlation between these two variables suggest that spending more money on pets causes people to consume more cheese? Explain. Per capita consumption of mozzarella (pounds) 11.0 10.5 10.0 9.5 40 45 50 55 60 65 70 Money spent on pets (billion dollars) Probably not. Although there is a strong, positive correlation, an increase in money spent on pets is not likely to cause people to consume more mozzarella cheese. It is likely that both of these variables are getting larger over time, which explains the association. Statistics and Probability with Applications, 3rd Edition 10 10
LESSON APP 2.3 If I eat more chocolate, will I win a Nobel prize? Most people love chocolate for its great taste. But does it also make you smarter? A scatterplot like this one recently appeared in the New England Journal of Medicine. The explanatory variable is the chocolate consumption per person for a sample of countries. The response variable is the number of Nobel Prizes per 10 million residents of that country. 1. Interpret the correlation of r = 0.791. If people in the United States started eating more chocolate, can we expect more Nobel Prizes to be awarded to residents of the United States? Explain. 2. Statistics and Probability with Applications, 3rd Edition 11 11
LESSON APP 2.3 If I eat more chocolate, will I win a Nobel prize? 1. Interpret the correlation of r = 0.791. 2. If people in the United States started eating more chocolate, can we expect more Nobel Prizes to be awarded to residents of the United States? Explain. Statistics and Probability with Applications, 3rd Edition 12 12
Correlation Learning Targets After this lesson, you should be able to: Estimate the correlation between two quantitative variables from a scatterplot. Interpret the correlation. Distinguish correlation from causation. Statistics and Probability with Applications, 3rd Edition 13 13