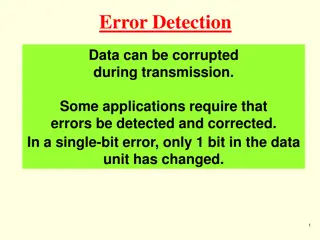
Understanding Standard Error of the Mean in Statistics
Statistical measures like standard error of the mean (SEM) help assess how closely a sample average represents the true population mean. Smaller SEM indicates more significant data with large sample sizes and low variation, while larger SEM signifies less significant data with small sample sizes and high variation. Error bars in graphs visually represent data significance, where overlapping bars suggest insignificance and non-overlapping bars denote significance. Through examples and visuals, grasp the concept of SEM, calculations, and its importance in data interpretation.

Uploaded on Sep 25, 2024 | 0 Views
Download Presentation

Please find below an Image/Link to download the presentation.
The content on the website is provided AS IS for your information and personal use only. It may not be sold, licensed, or shared on other websites without obtaining consent from the author. Download presentation by click this link. If you encounter any issues during the download, it is possible that the publisher has removed the file from their server.
E N D
Presentation Transcript
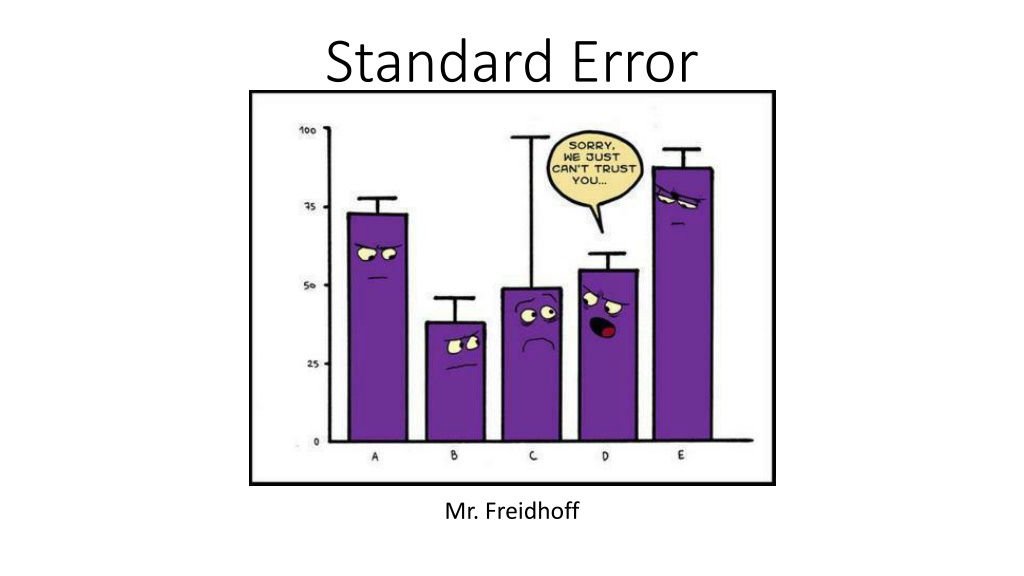
Standard Error Mr. Freidhoff
Standard Error of the Mean Statistical measure of how far the sample average of the data is likely to be from the true population mean. Standard error bars Graph 2 SEMs.
Standard Error of the Mean Smaller error bars indicate more significant data. Large data sample sizes Small variation in data Larger error bars indicates less significant data. Small data sample sizes Large variation in data
Standard Error Bars When error bars overlap, the data is not significant. When error bars don t overlap, data is significant.
Graphing Standard Error of the Mean Data A Mean = 10 SEM = +/- 1 Data B Mean = 8 SEM = +/- 3
Standard Error of the Mean SEx= standard error of the mean S = standard deviation n = number of data points
Example Problem S = 1.58 n = 5 x = 3 SEM = 1.58/ (5) SEM = 0.7
Mean Standard Error: 4 3.5 3 2.5 2 1.5 1 0.5 0 Data Set 1 Data Set 2